
MSSP UI Tour
What an MSSP operator sees after sign-in. Read this once before Daily Operations so the runbooks make sense.
Scope: MSSP-wide vs single tenant
Every MSSP user has two operating scopes:
- All tenants: cross-tenant queues and aggregate views. This is the default for
mssp_admin. The top-right corner shows an All tenants chip. - Single tenant: the MSSP admin has opened one customer's SOC (the chip reads
Tenant: <name>). All views are scoped to that tenant; the Clear button next to the chip switches back to MSSP-wide.
Scope drives the navigation rail too. In MSSP-wide scope you see Tenants in the rail; in tenant scope it is hidden because tenant-detail screens take its place.
Navigation rail
The left rail is persistent on every page. From top to bottom:
| Icon | Page | What it shows |
|---|---|---|
| SocTalk | / | Home / dashboard |
| Dashboard | / | MSSP KPI tiles + investigation throughput chart |
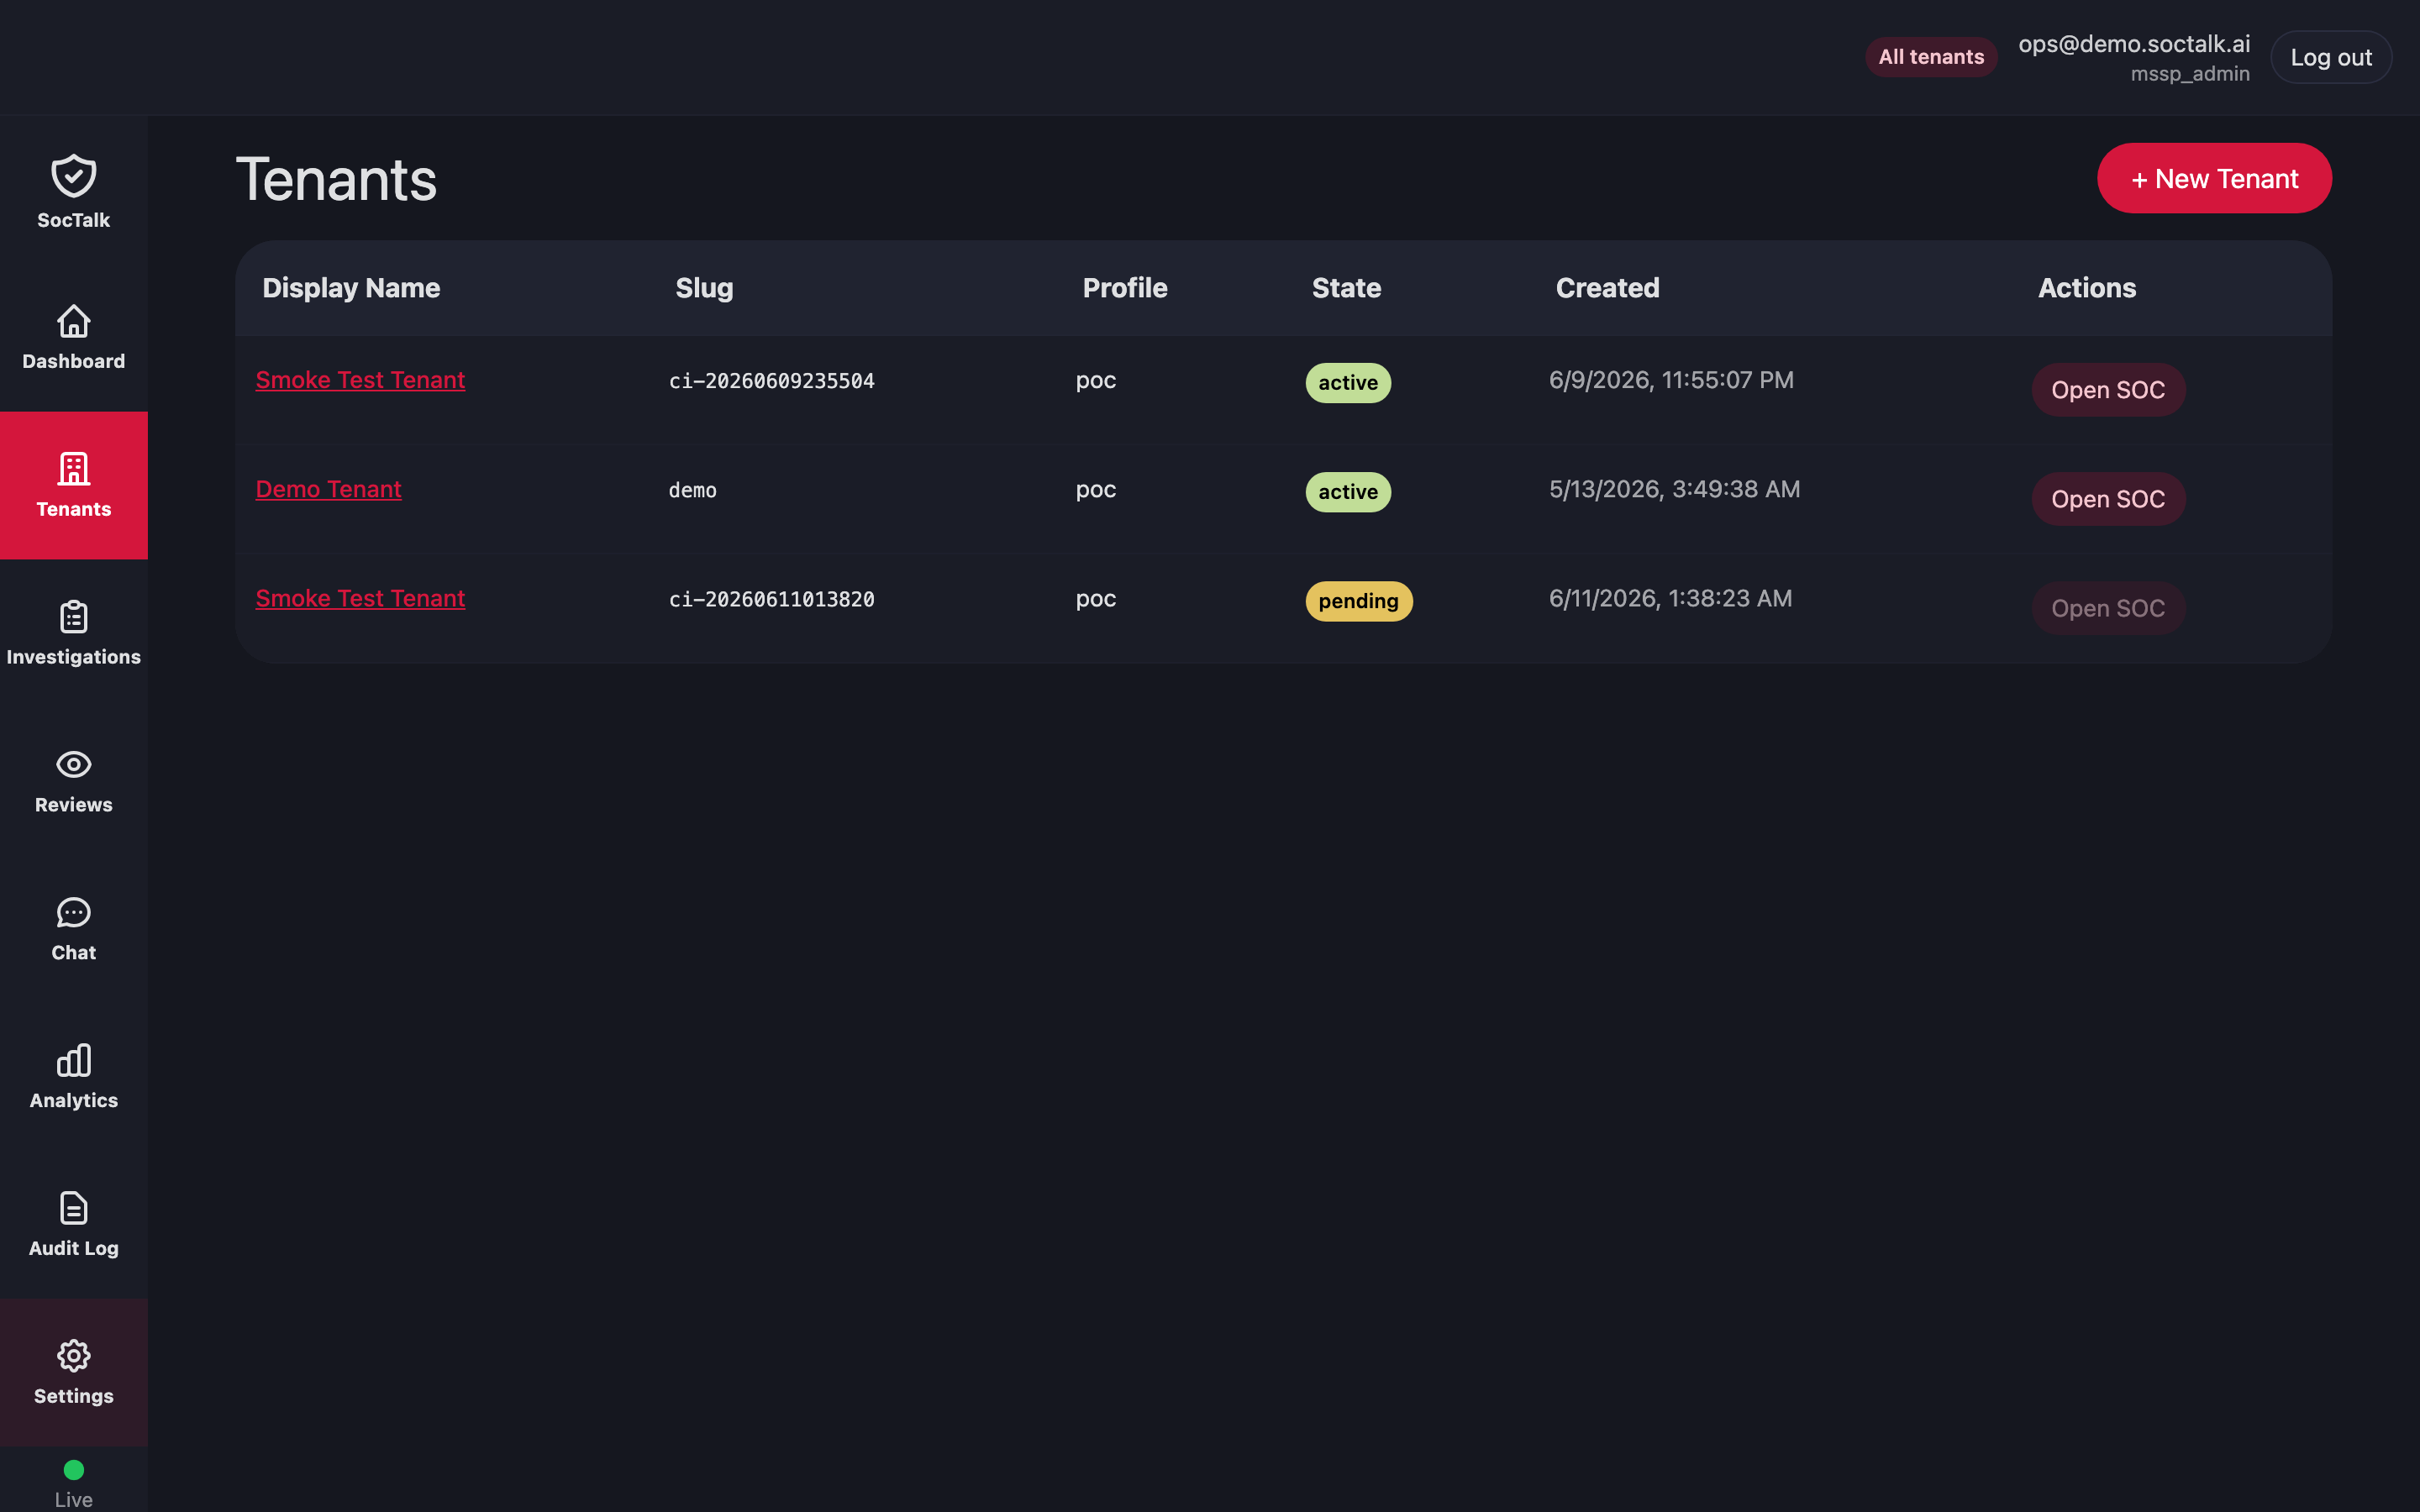
| Tenants | /tenants | All customer SOCs (MSSP-wide scope only) |
| Investigations | /investigations | Cross-tenant queue of active cases |
| Reviews | /review | Human-in-the-loop proposal queue |
| Chat | /chat | Operator chat with the SocTalk agent |
| Analytics | /analytics | Service-level trends across tenants |
| Audit Log | /audit | Append-only event log |
| Settings | /settings | LLM provider, integration toggles |
| Live / Offline | — | Realtime connection indicator (WebSocket health) |
Top-right of every page is the user chip (email, role) and a Log out button.
The application UI ships localized in seven languages, switchable in-app from the language selector, which lists each option under its own native name: English, Português (Brasil), Español (Latinoamérica), 中文(简体), Français, Deutsch, Italiano.
Dashboard
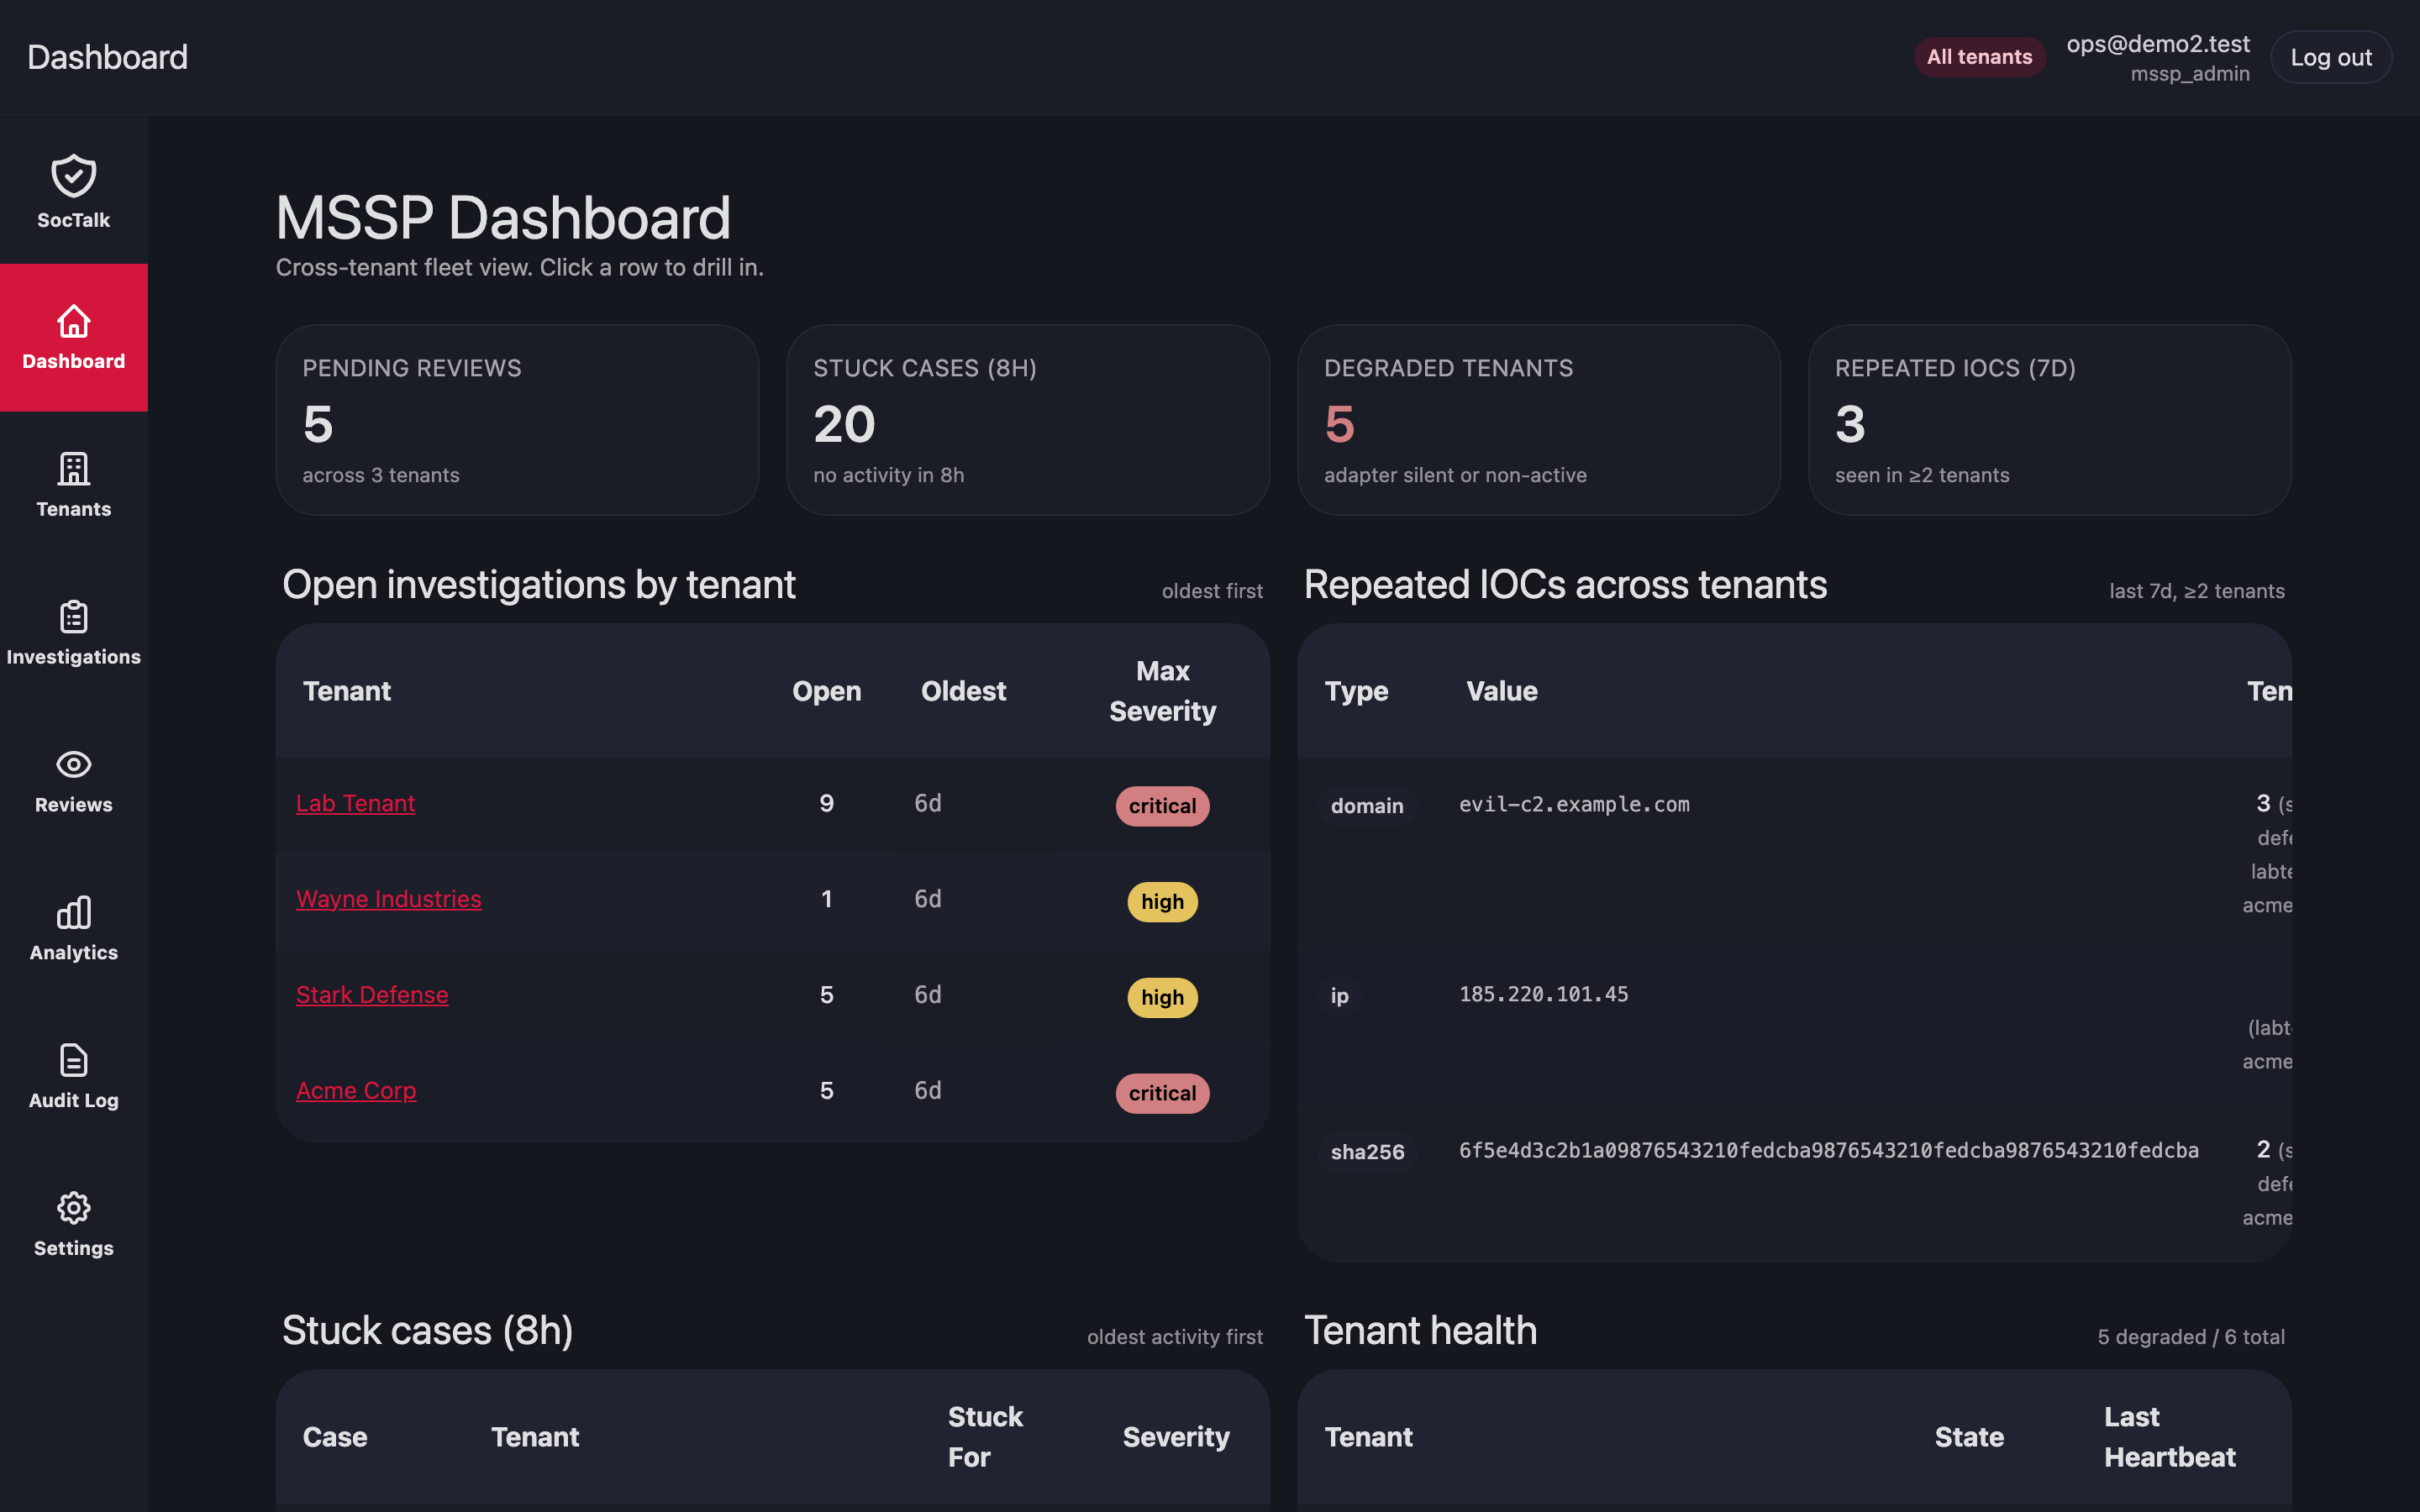
KPI tiles on the top row (Open Investigations, Pending Reviews, Avg Time to Triage, Avg Time to Verdict) and a second row of operational counters (Created Today, Closed Today, Escalations, Auto-Closed, Malicious IOCs).
Below the tiles:
- Investigation Throughput (24h): bar+line chart of created / manually closed / auto-closed / escalated / backlog.
- Verdicts Today: running tally of the day's AI verdicts.
- Active Investigations: short list of in-progress cases with a deep link to each.
The chart is the most-watched widget for capacity planning; if backlog (red line) trends up while throughput stays flat, the MSSP is under-provisioned or the model is failing too many cases through to human review.
Tenants
Tenants list
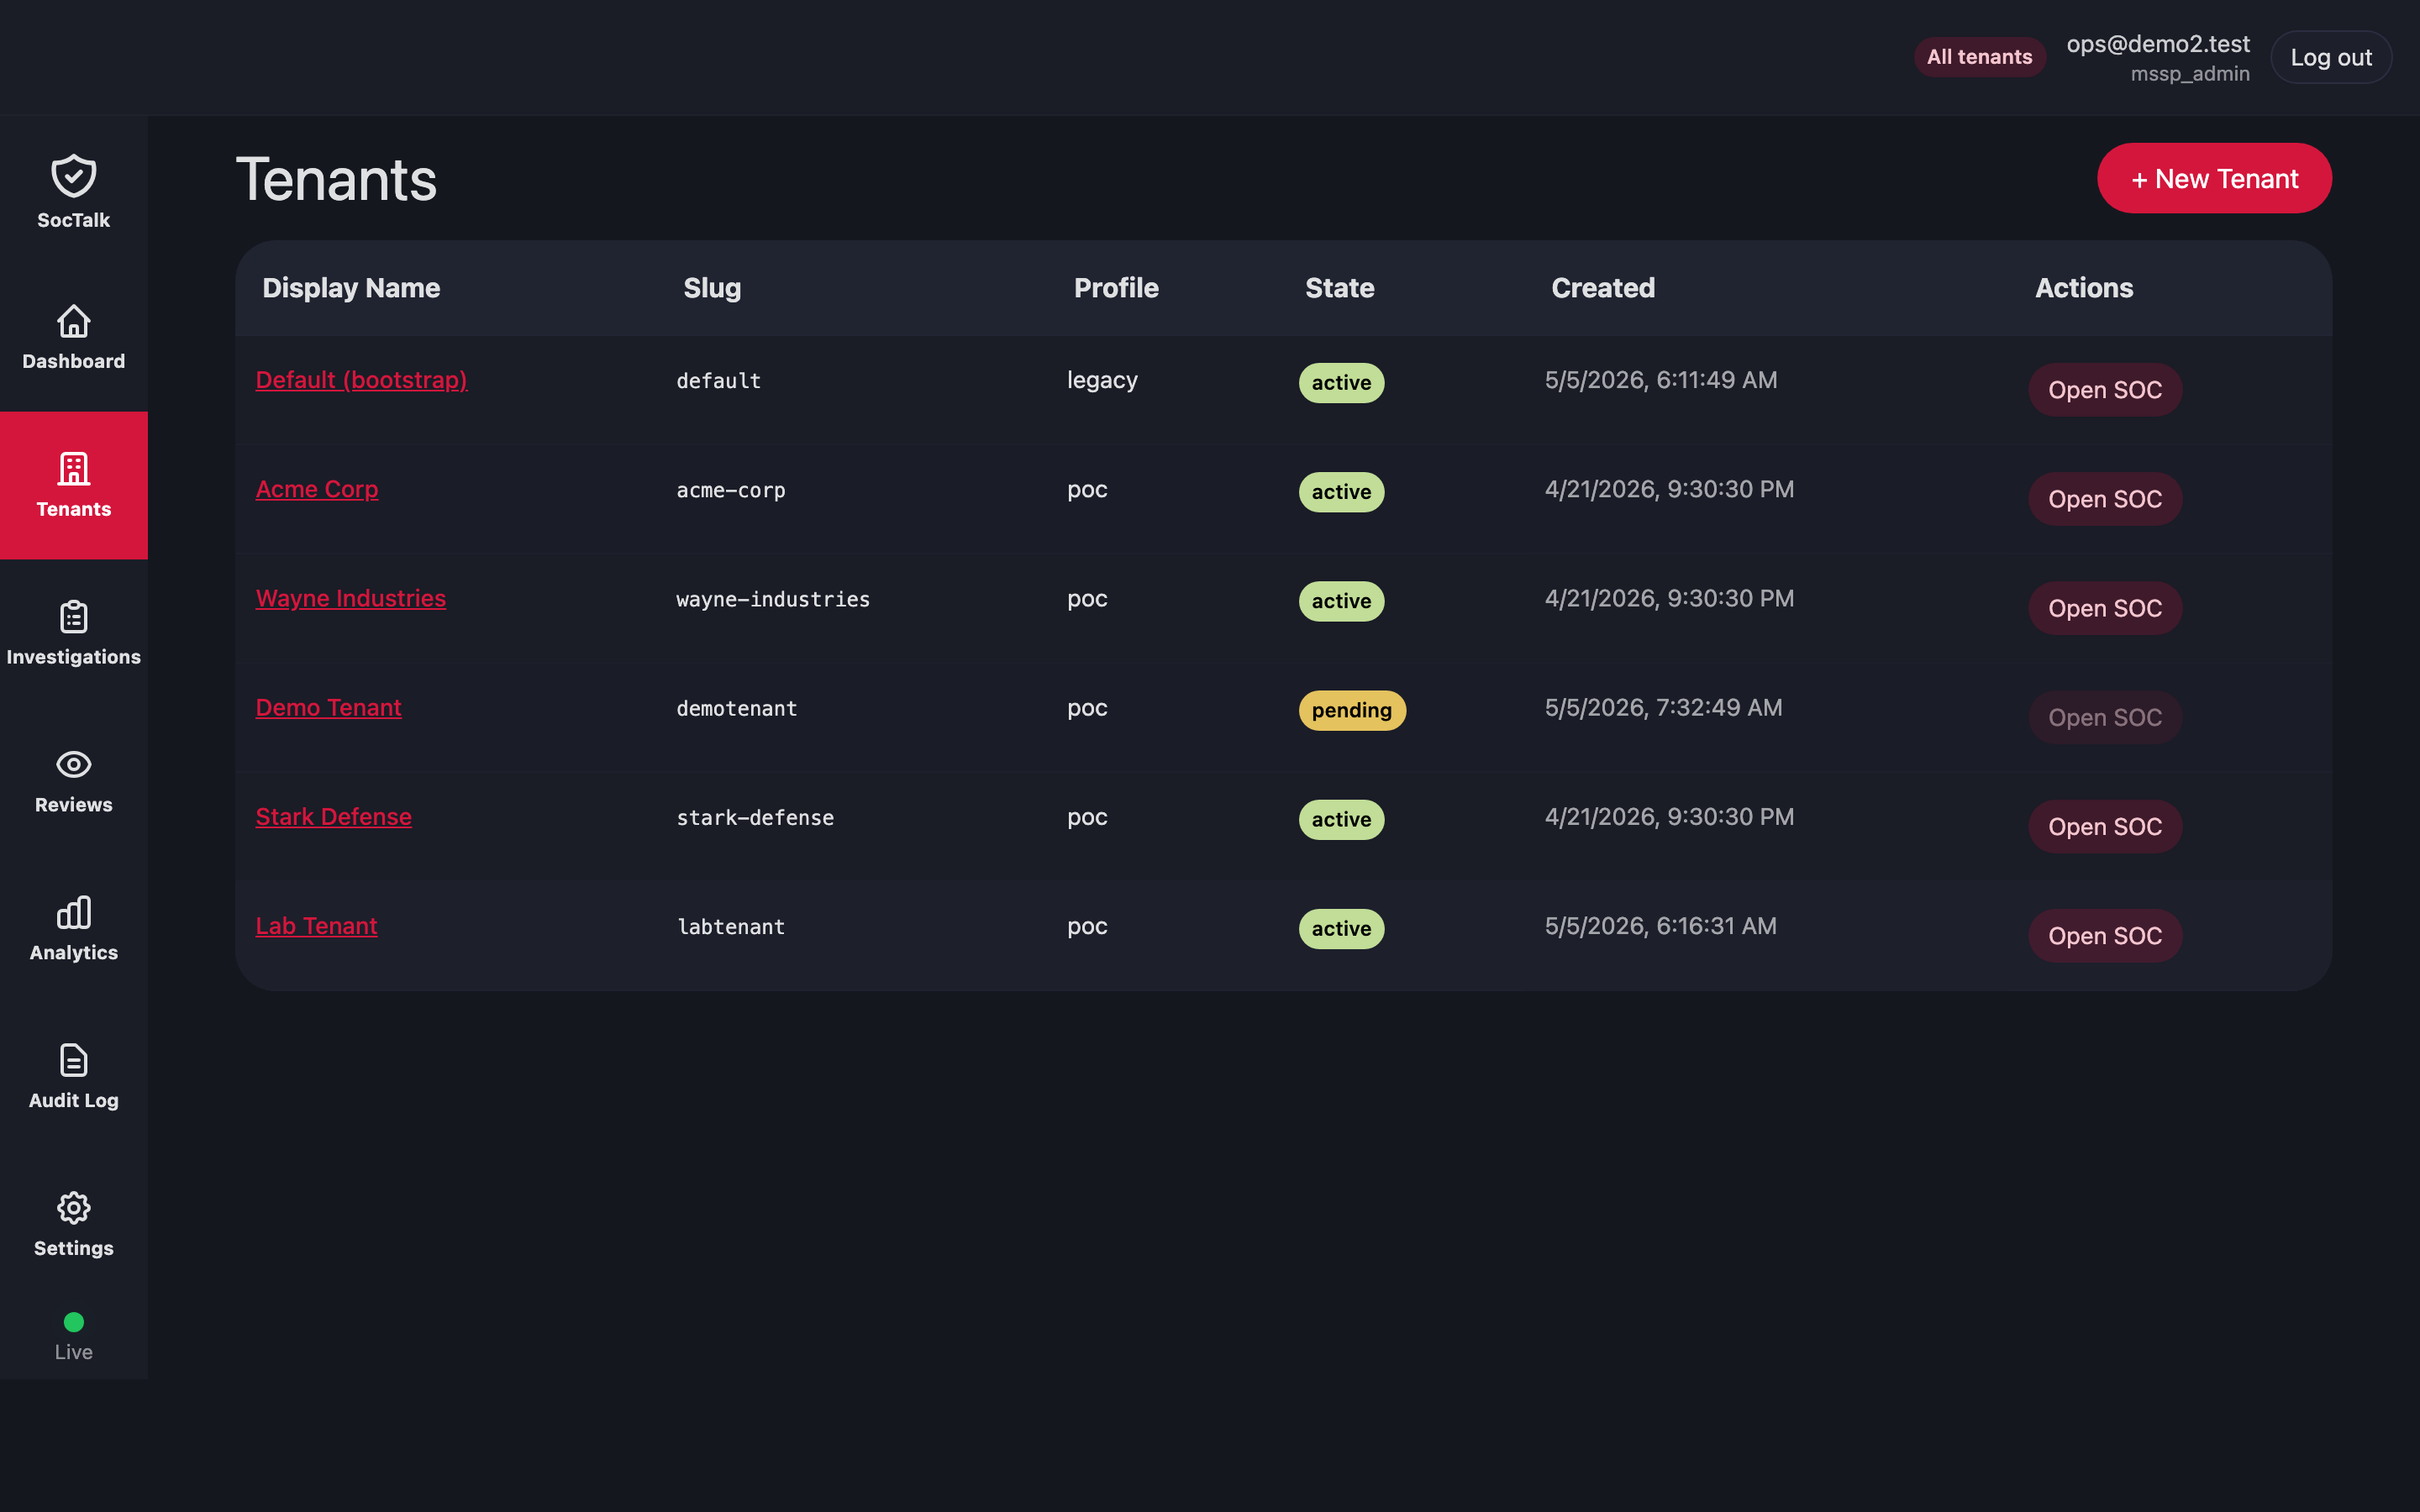
One row per customer. Columns: Display Name, Slug, Profile (poc or persistent), State (pending | provisioning | active | degraded | suspended | decommissioning | archived | purged), Created, Actions.
The + New Tenant button opens the onboarding form. Profile is fixed at create time; switching later requires decommission + recreate.
Tenant detail
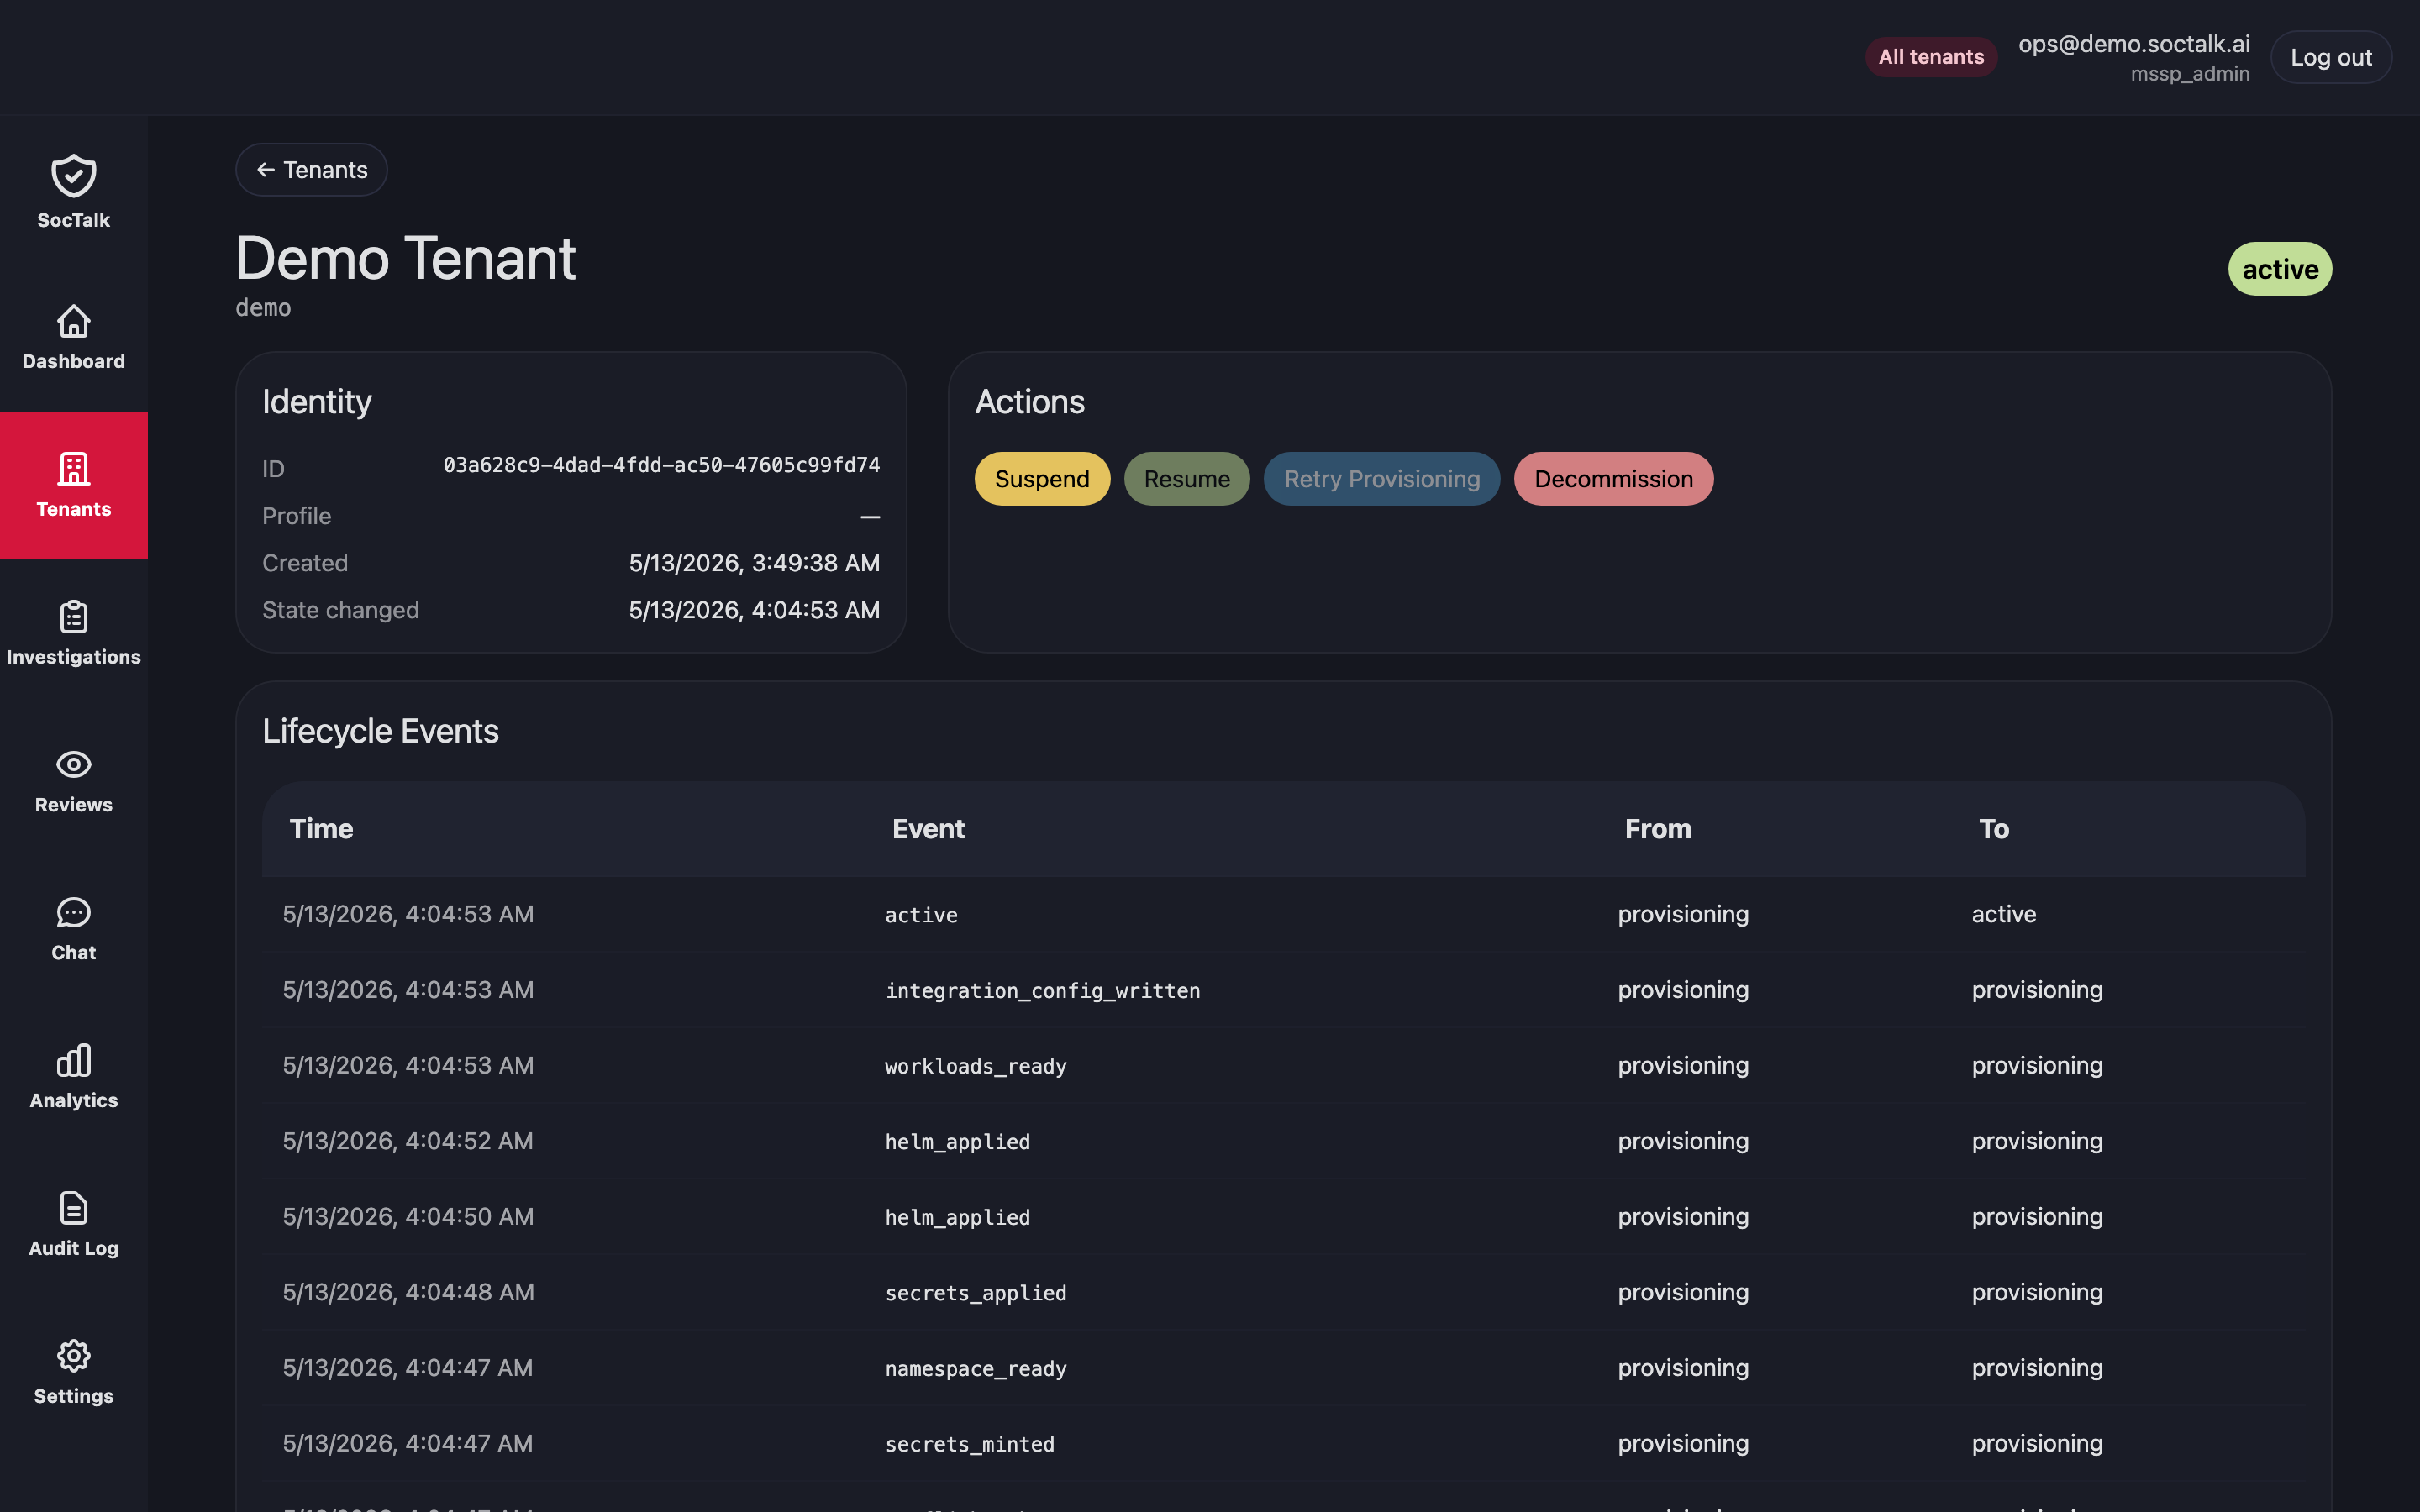
Three sections:
- Identity: tenant ID, profile, created / state-changed timestamps. Slug appears under the display name in the header.
- Actions: Suspend / Resume / Retry Provisioning / Decommission. Suspend in this release flips the tenant's state to
suspendedso the orchestrator stops scheduling new investigations; it does not scale workloads. For a definitive cut-off, follow Daily Operations → Emergency disable. Retry Provisioning only works on tenants indegraded: the API rejects:retryon tenants inpending(pending → provisioningis automatic on first attempt). - Lifecycle Events: chronological log of the provisioning state machine:
preflight_ok → secrets_minted → namespace_ready → secrets_applied → helm_applied (soctalk-tenant chart) → helm_applied (Wazuh chart) → workloads_ready → integration_config_written → active. The twohelm_appliedrows are distinguishable via the event payload (chart identity). When a tenant gets stuck this table tells you which step failed.
The page is read-only otherwise; the per-tenant SOC opens in its own window via the Open SOC action on the tenants list. Wazuh is the in-namespace data plane; TheHive and Cortex are external integrations, not bundled per-tenant components.
Investigations
List
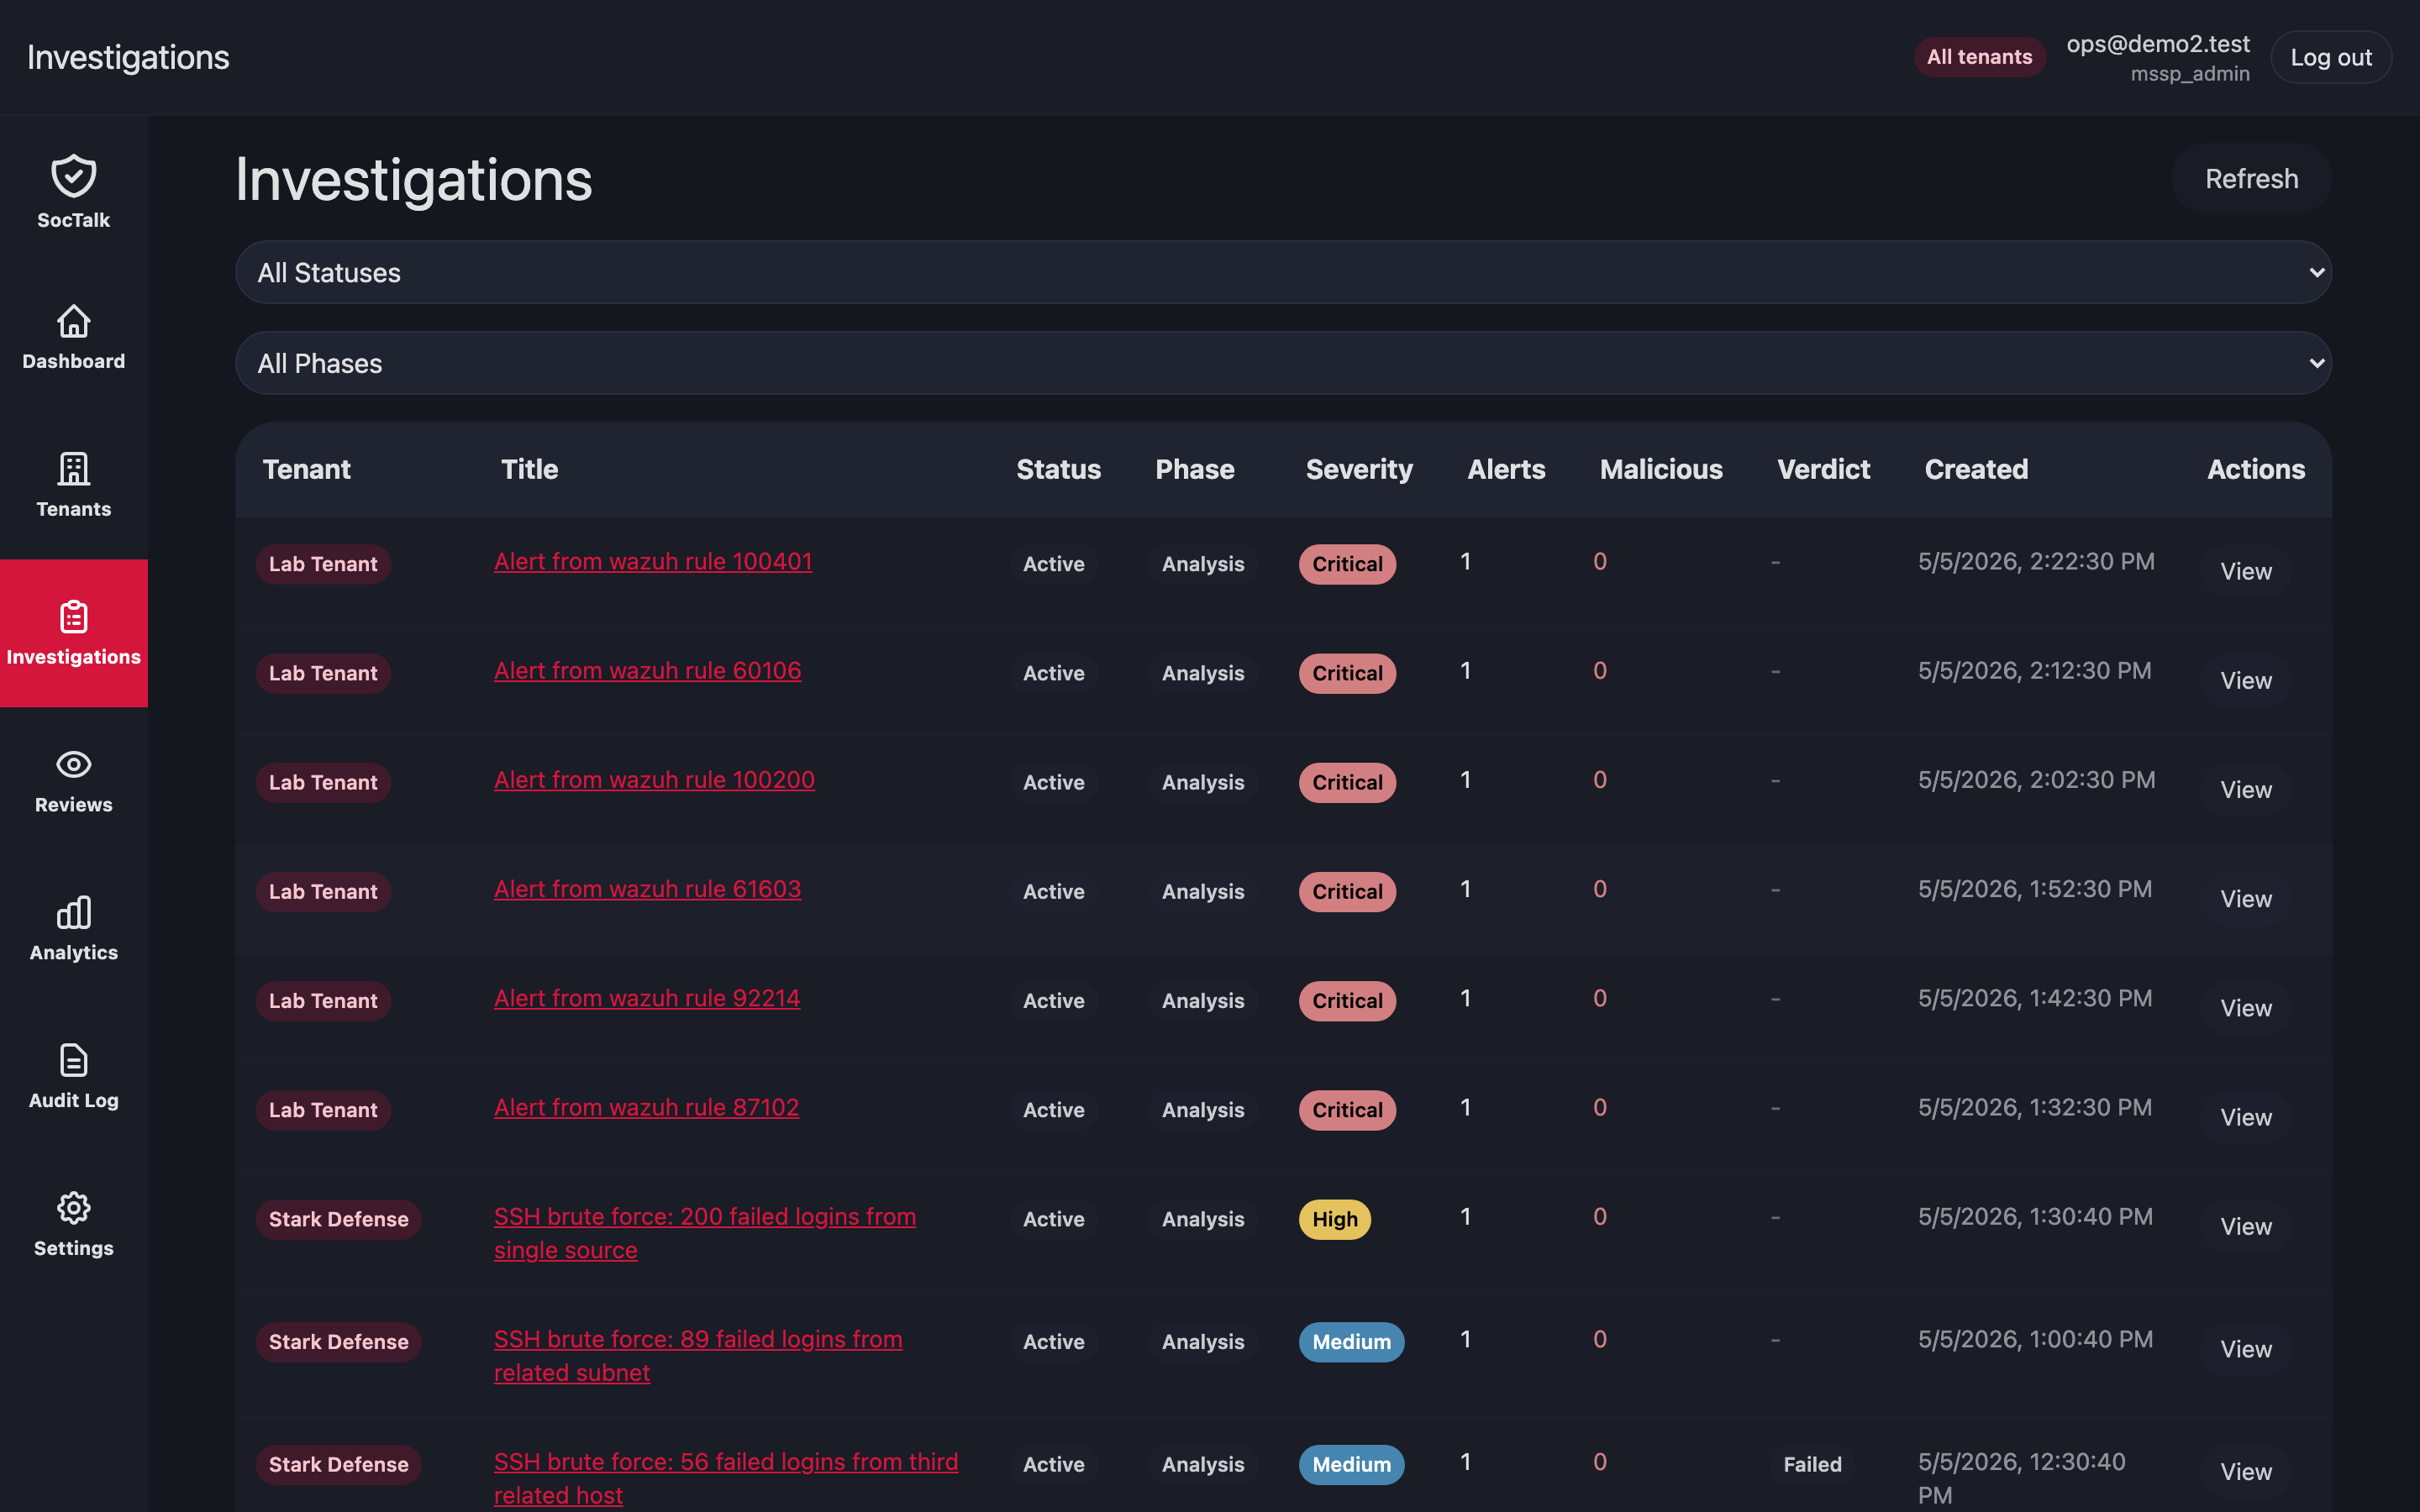
Cross-tenant queue. Filters: status (Pending / Active / Awaiting Enrichment / Awaiting Verdict / Awaiting Human / Escalated / Closed) and phase (Triage / Enrichment / Analysis / Verdict / Escalation / Closed). Each row shows Tenant, Title, Status, Phase, Severity (Critical / High / Medium / Low), Alert count, Malicious IOC count, Verdict, Created, Actions.
Click View (or the title) to open the detail page.
Detail
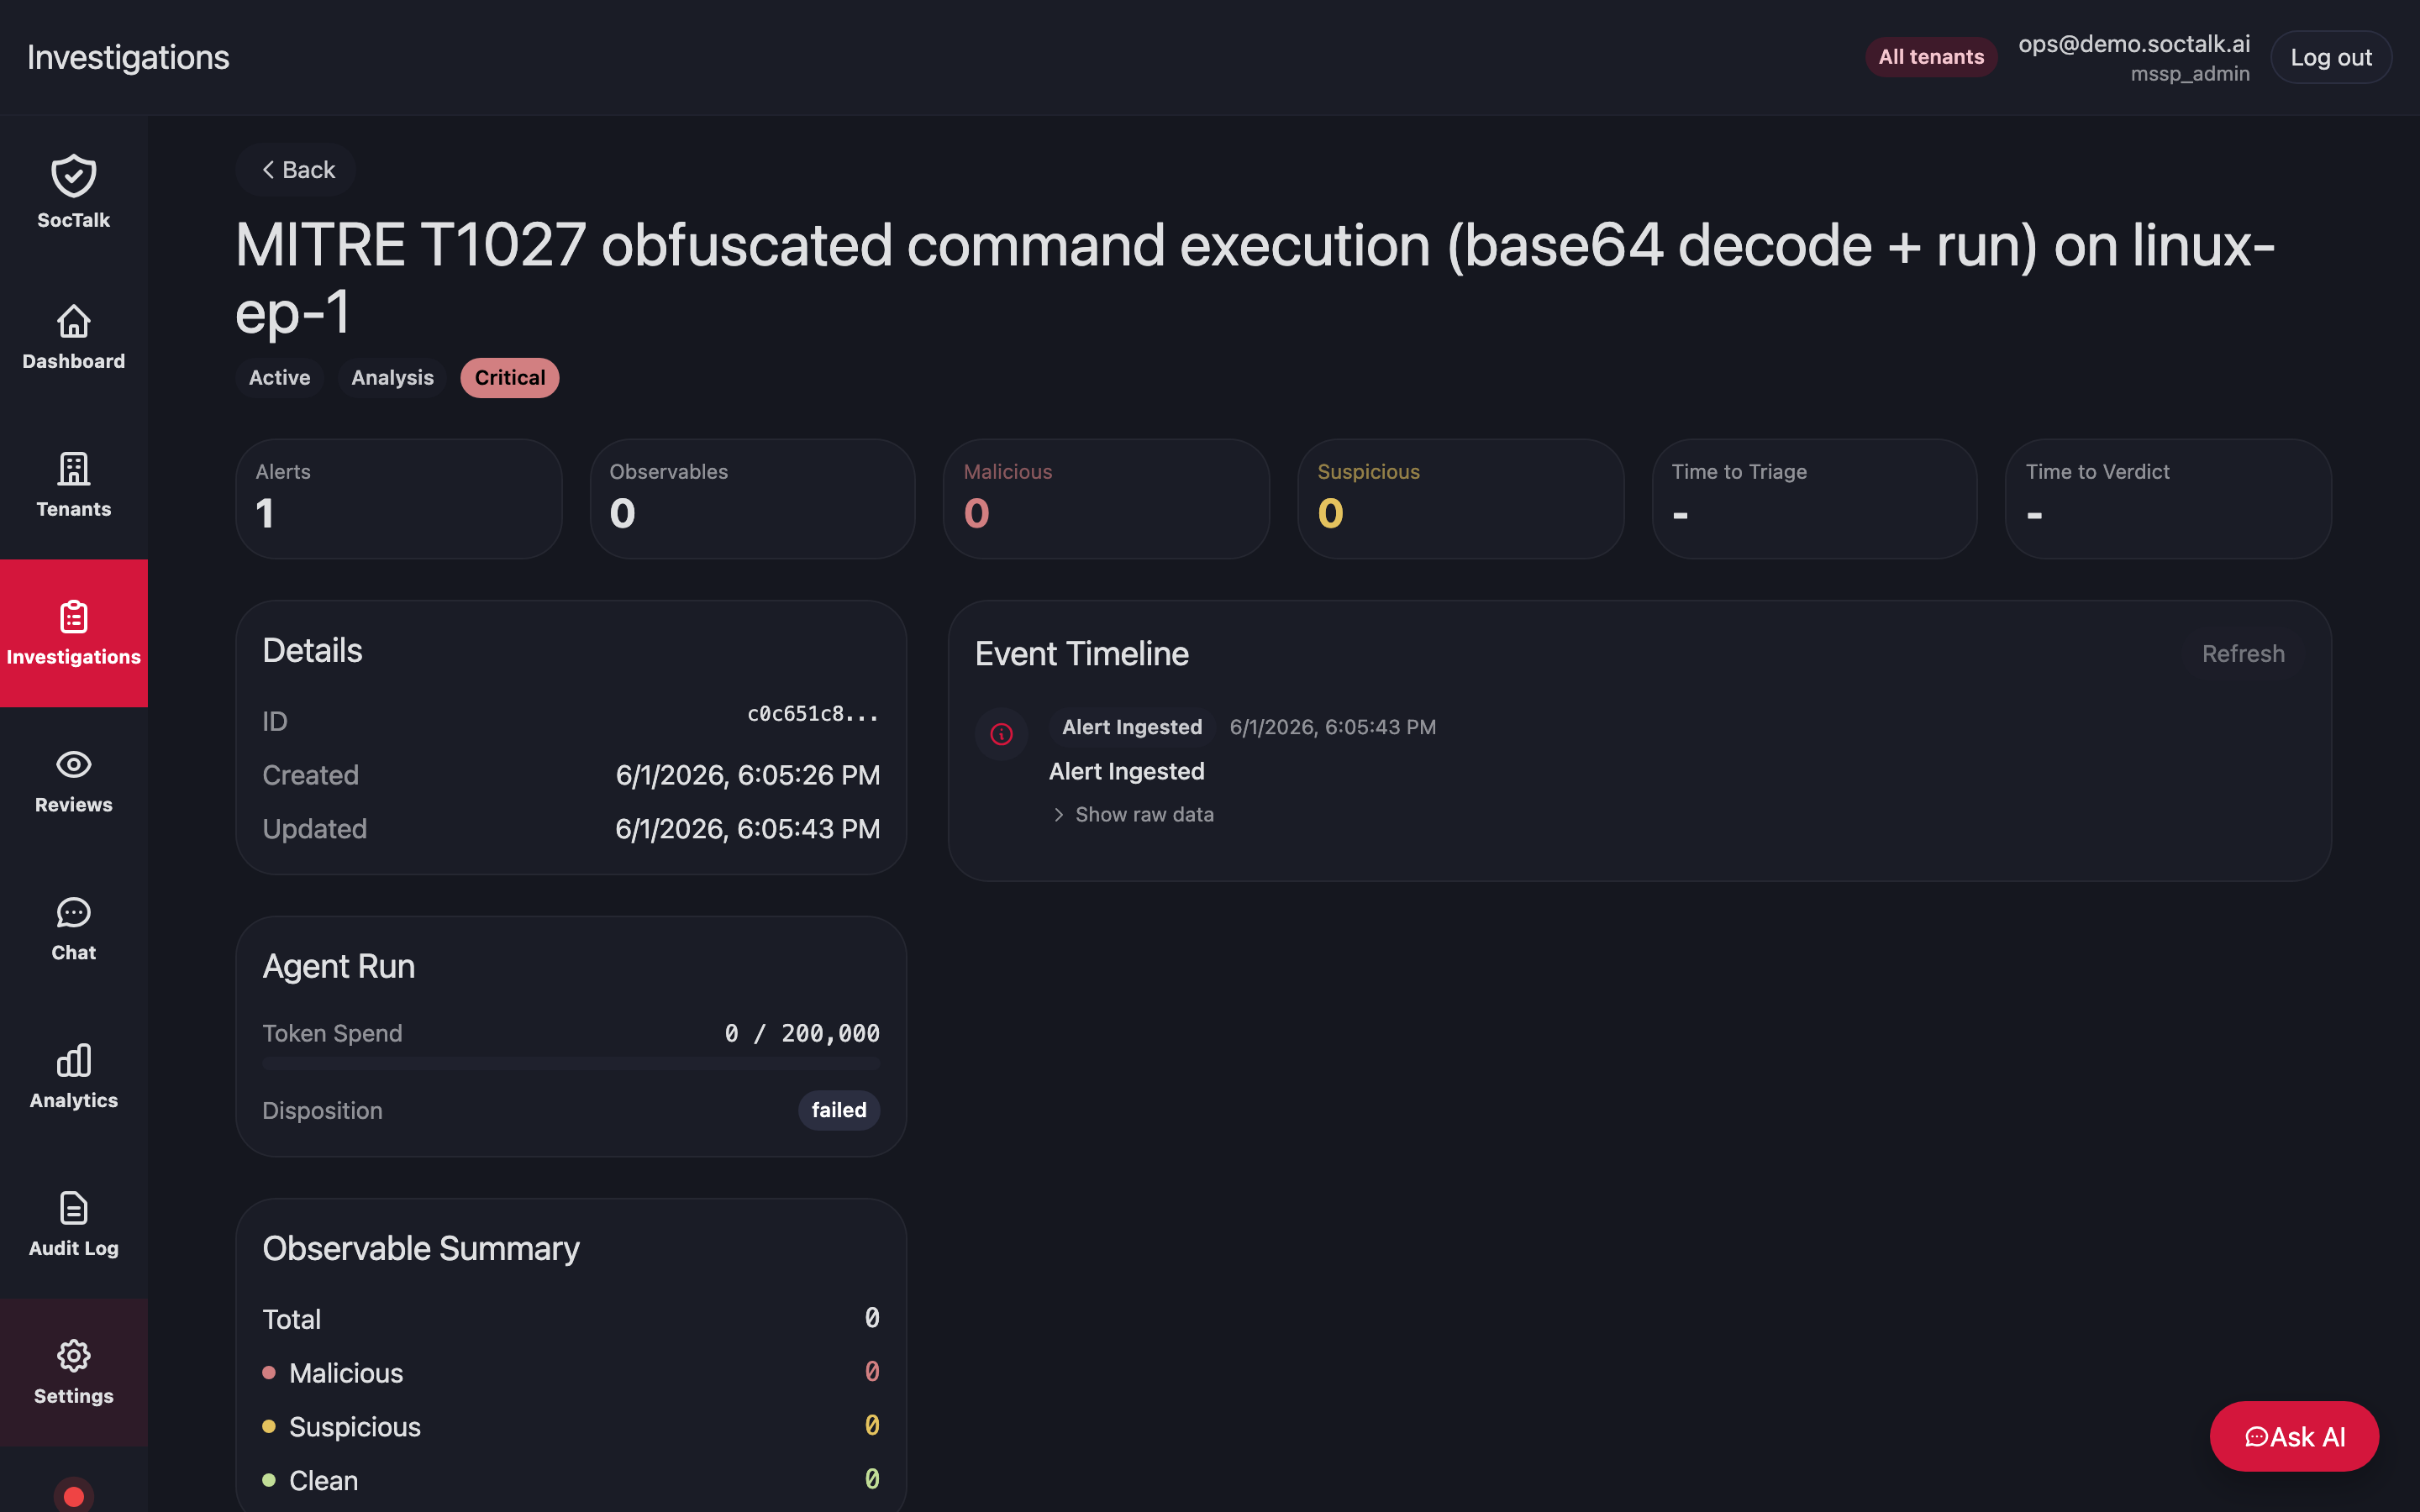
Layout:
- Header: title, status badges (Active/Closed, current Phase, Severity).
- KPI tiles: Alerts, Observables (total/malicious/suspicious), Time to Triage, Time to Verdict.
- Details: ID, Created, Updated.
- Event Timeline: chronological event inbox for the case (immutable, append-only).
- Agent Run: token spend vs the configured per-run budget (
case_runs.tokens_budget, model default 200,000) and disposition (pending | active | failed | completed). - Observable Summary: totals broken down as Malicious / Suspicious / Clean.
The Ask AI floating button opens a side conversation that operates against this case's context.
Reviews (human-in-the-loop)
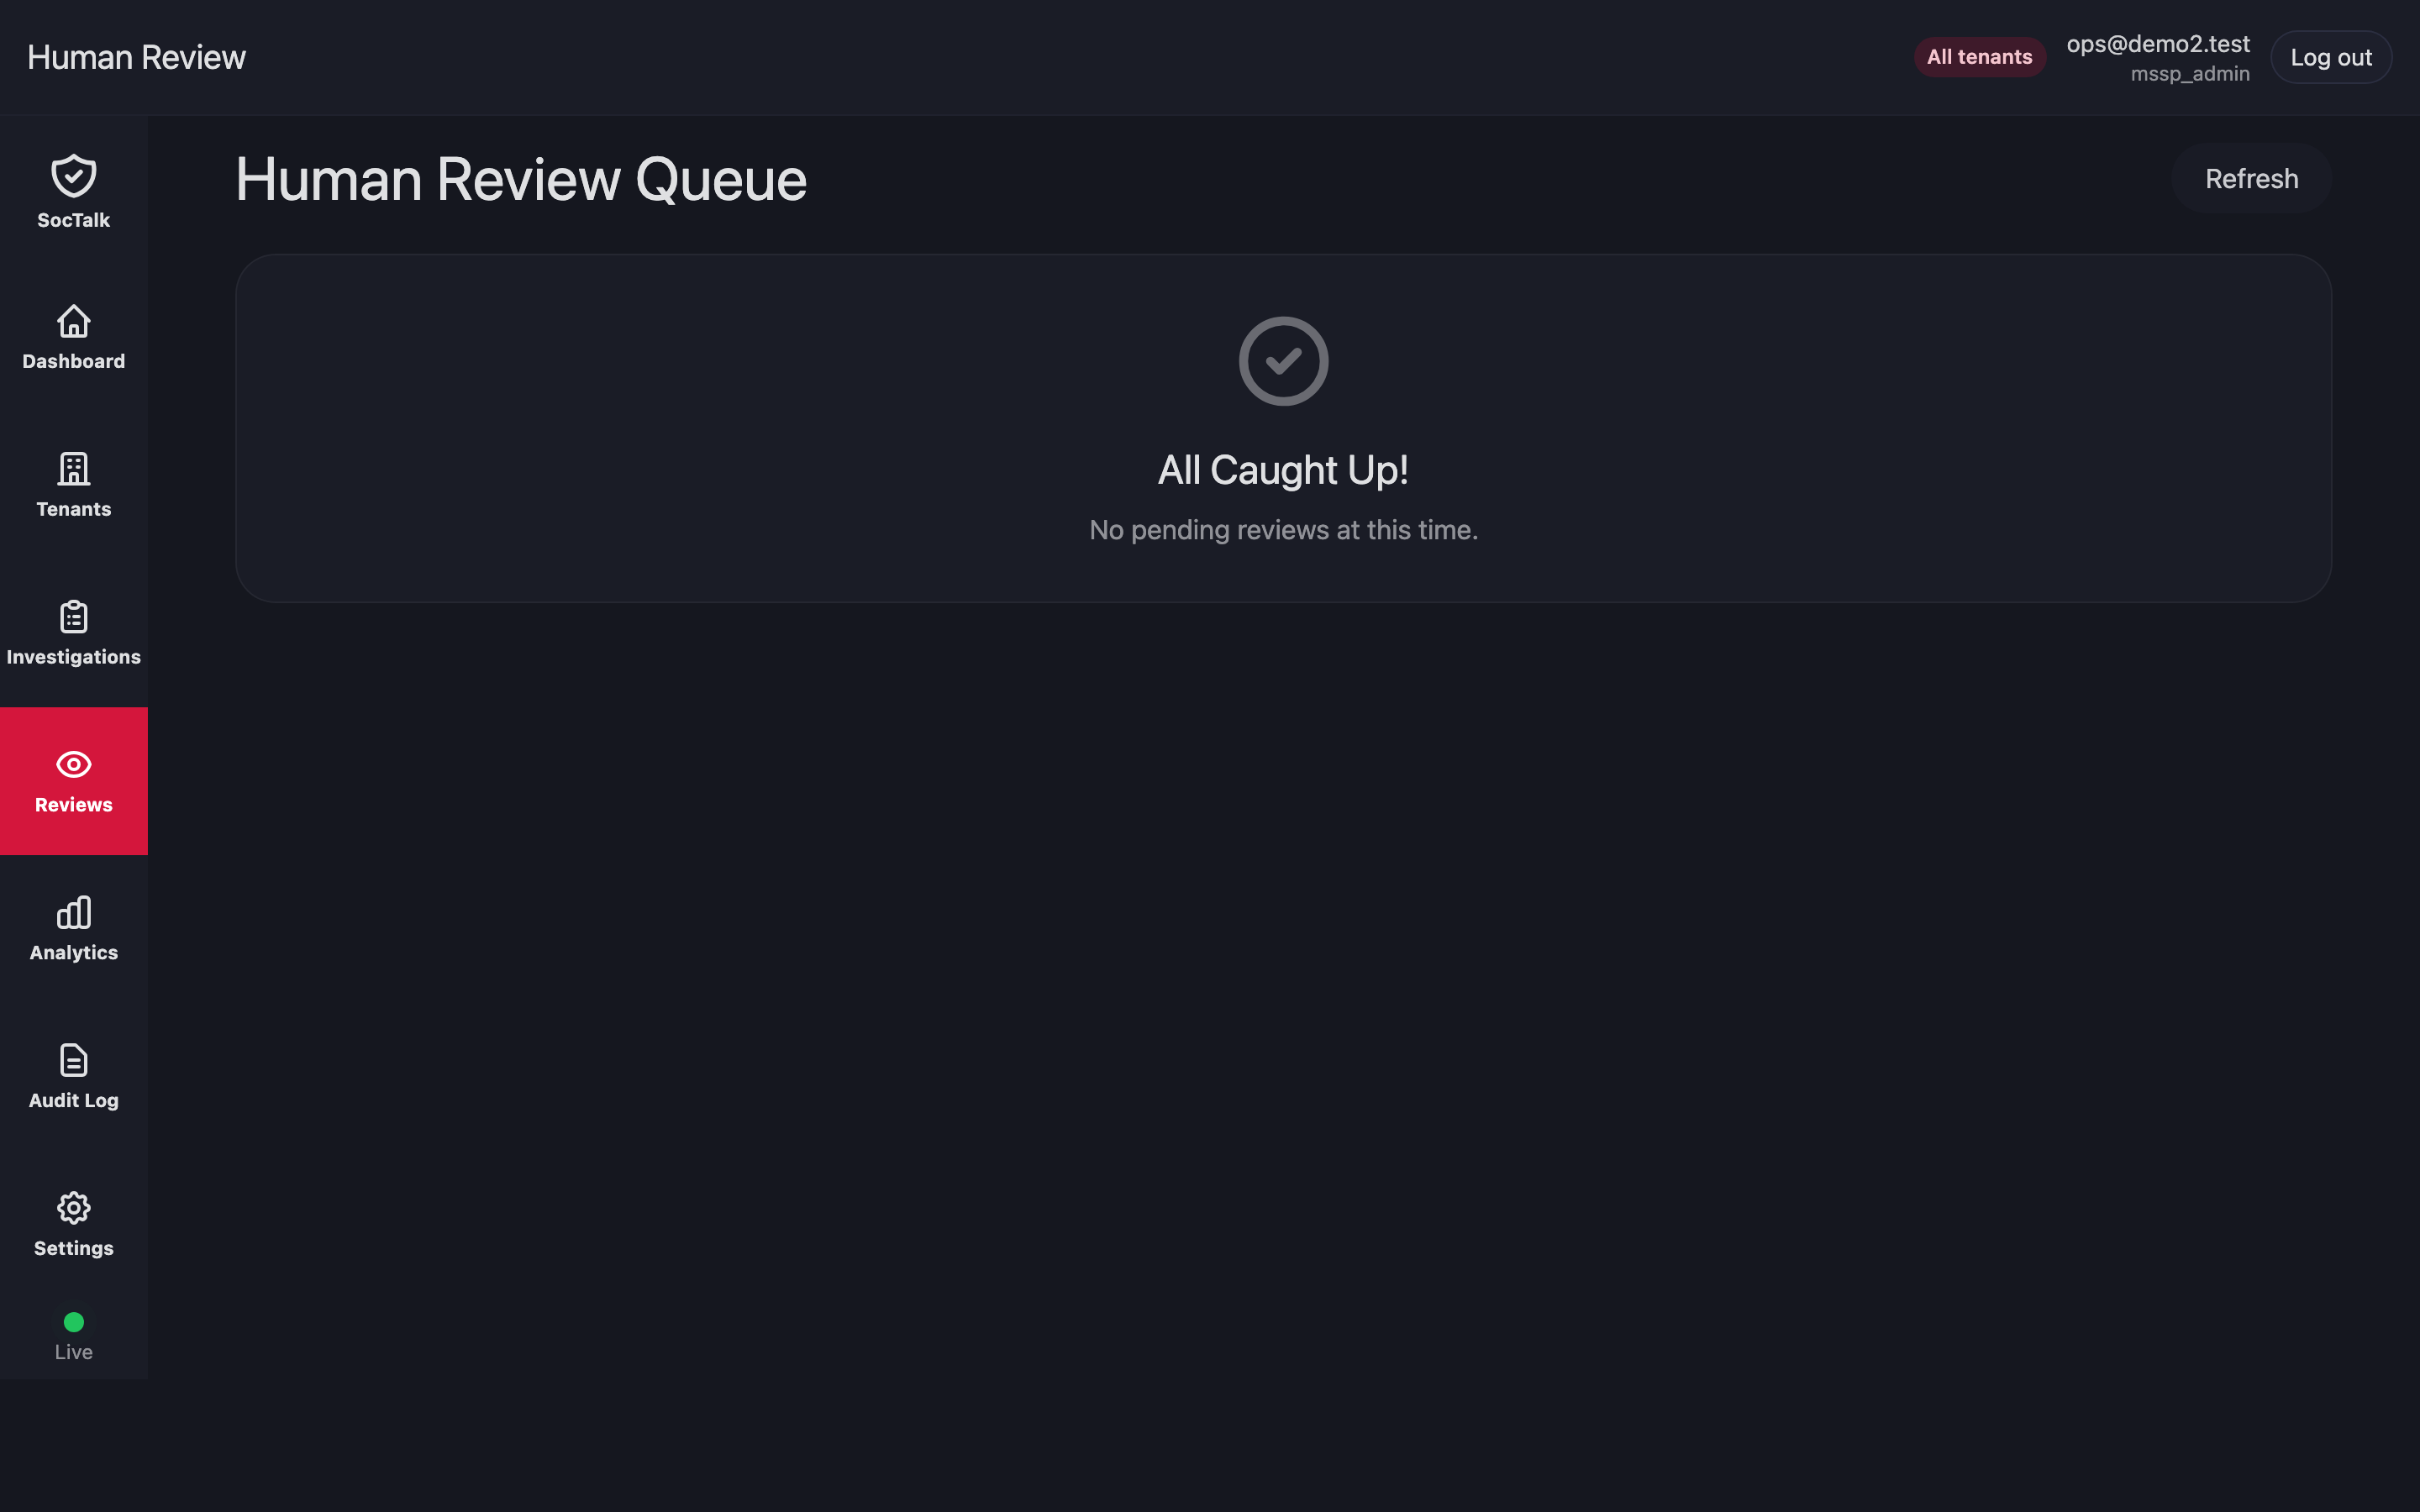
The cross-tenant queue of AI proposals awaiting a human gate. Each row shows the proposal title, alert count, deadline, severity, AI verdict chip (AI: Escalate / Close / Needs More Info), and a Review button.
Reviewing posts the decision (approve | reject | more_info) which updates the pending review row in the database. In V1 there is no outbox-based downstream pipeline; the decision stops at the review row + audit log. Any TheHive case creation or Slack notification has to happen inline during the AI graph run.
A Slack two-way HIL backend exists in code (src/soctalk/hil/backends/slack.py) but is not wired into the V1 chart's runtime. The dashboard queue is the only working HIL surface today.
Chat
The chat page opens an operator conversation with the SocTalk agent. Scope-aware: in MSSP-wide scope you can ask across tenants; in tenant scope the conversation is bound to one customer's data. Useful for ad-hoc questions ("show me this week's brute-force attempts on tenant X") that don't merit a saved query.
Analytics
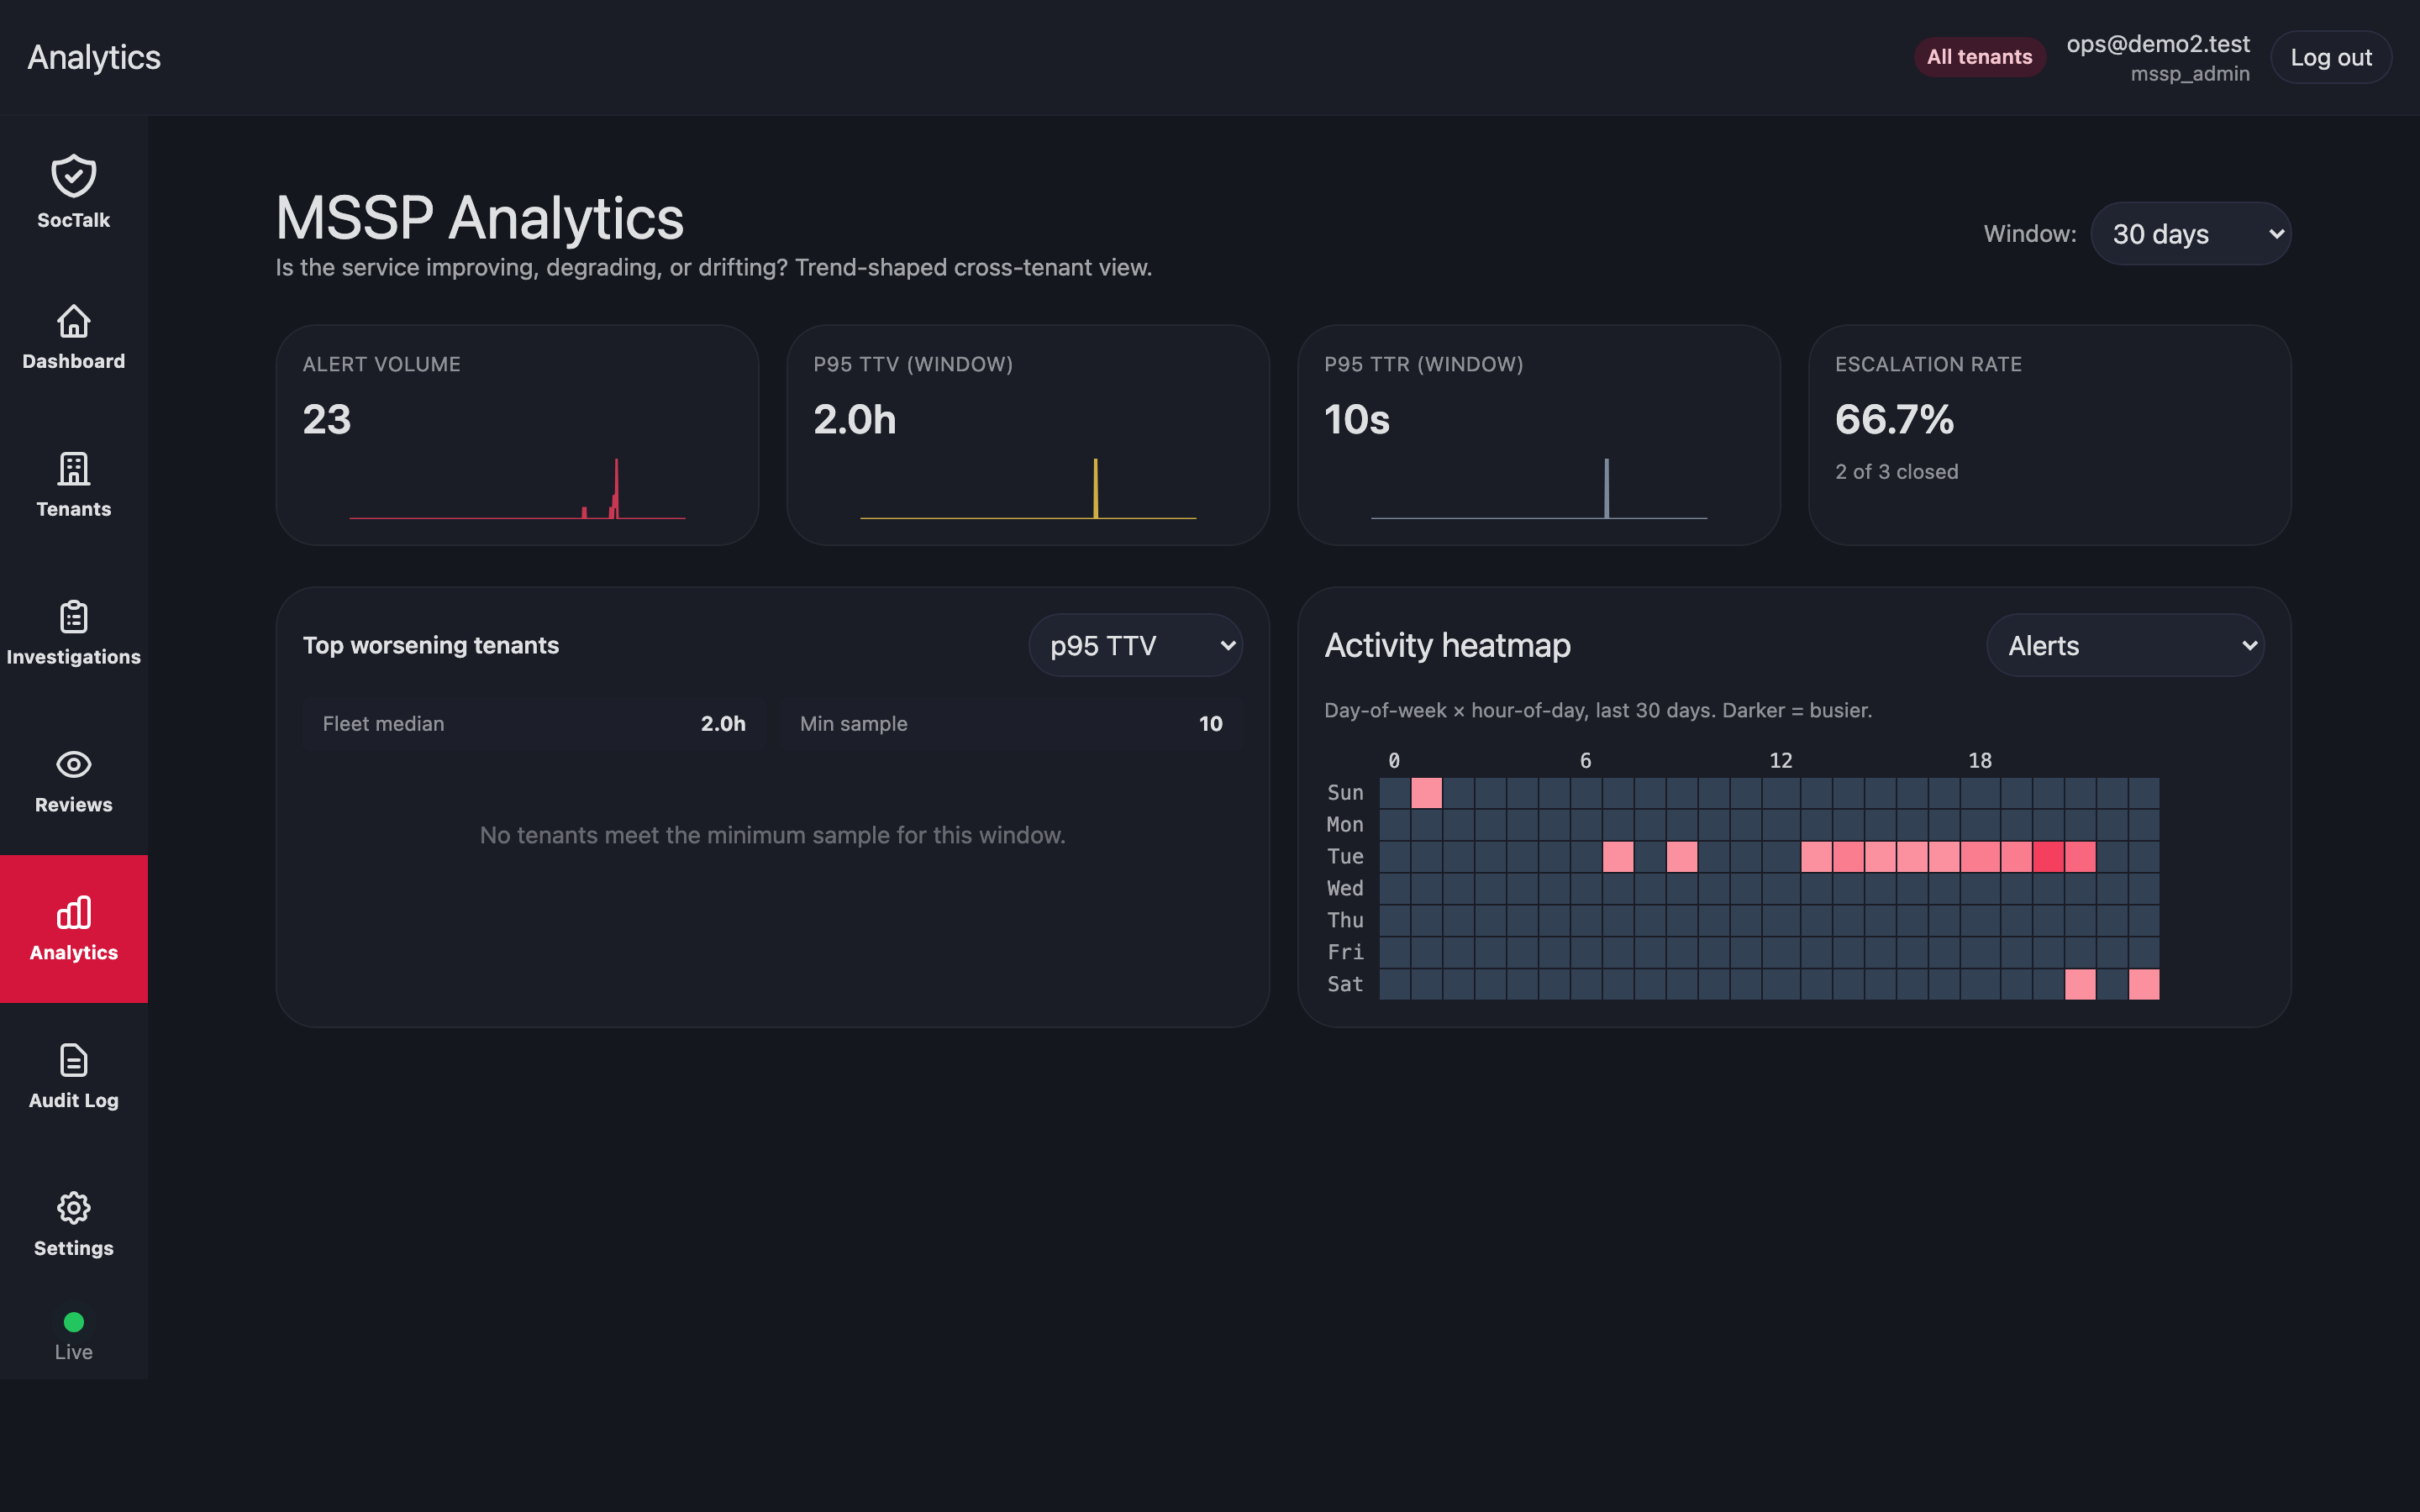
Trend-shaped cross-tenant view, time-bucketed (default Window: 30 days). Reports:
- Alert Volume
- p95 TTV (time-to-verdict, AI)
- p95 TTR (time-to-review, human-gate)
- Escalation Rate
- Top worsening tenants: sorted by p95 TTV delta vs the prior window
- Activity heatmap: day-of-week × hour-of-day, alerts (toggleable to other dimensions)
Use this for capacity planning, model-version evaluation, and SLA review.
Decision analytics
Pinning the Analytics page to a single tenant swaps the cross-tenant trends above for a set of decision-focused surfaces for that customer:
- Confidence Distribution: how AI decision confidence is spread across triaged alerts, bucketed by confidence.
- Decision Trends: how the mix of decisions (close, escalate, and so on) moves over time.
- Average Confidence by Decision: mean confidence broken out per decision type.
Audit log
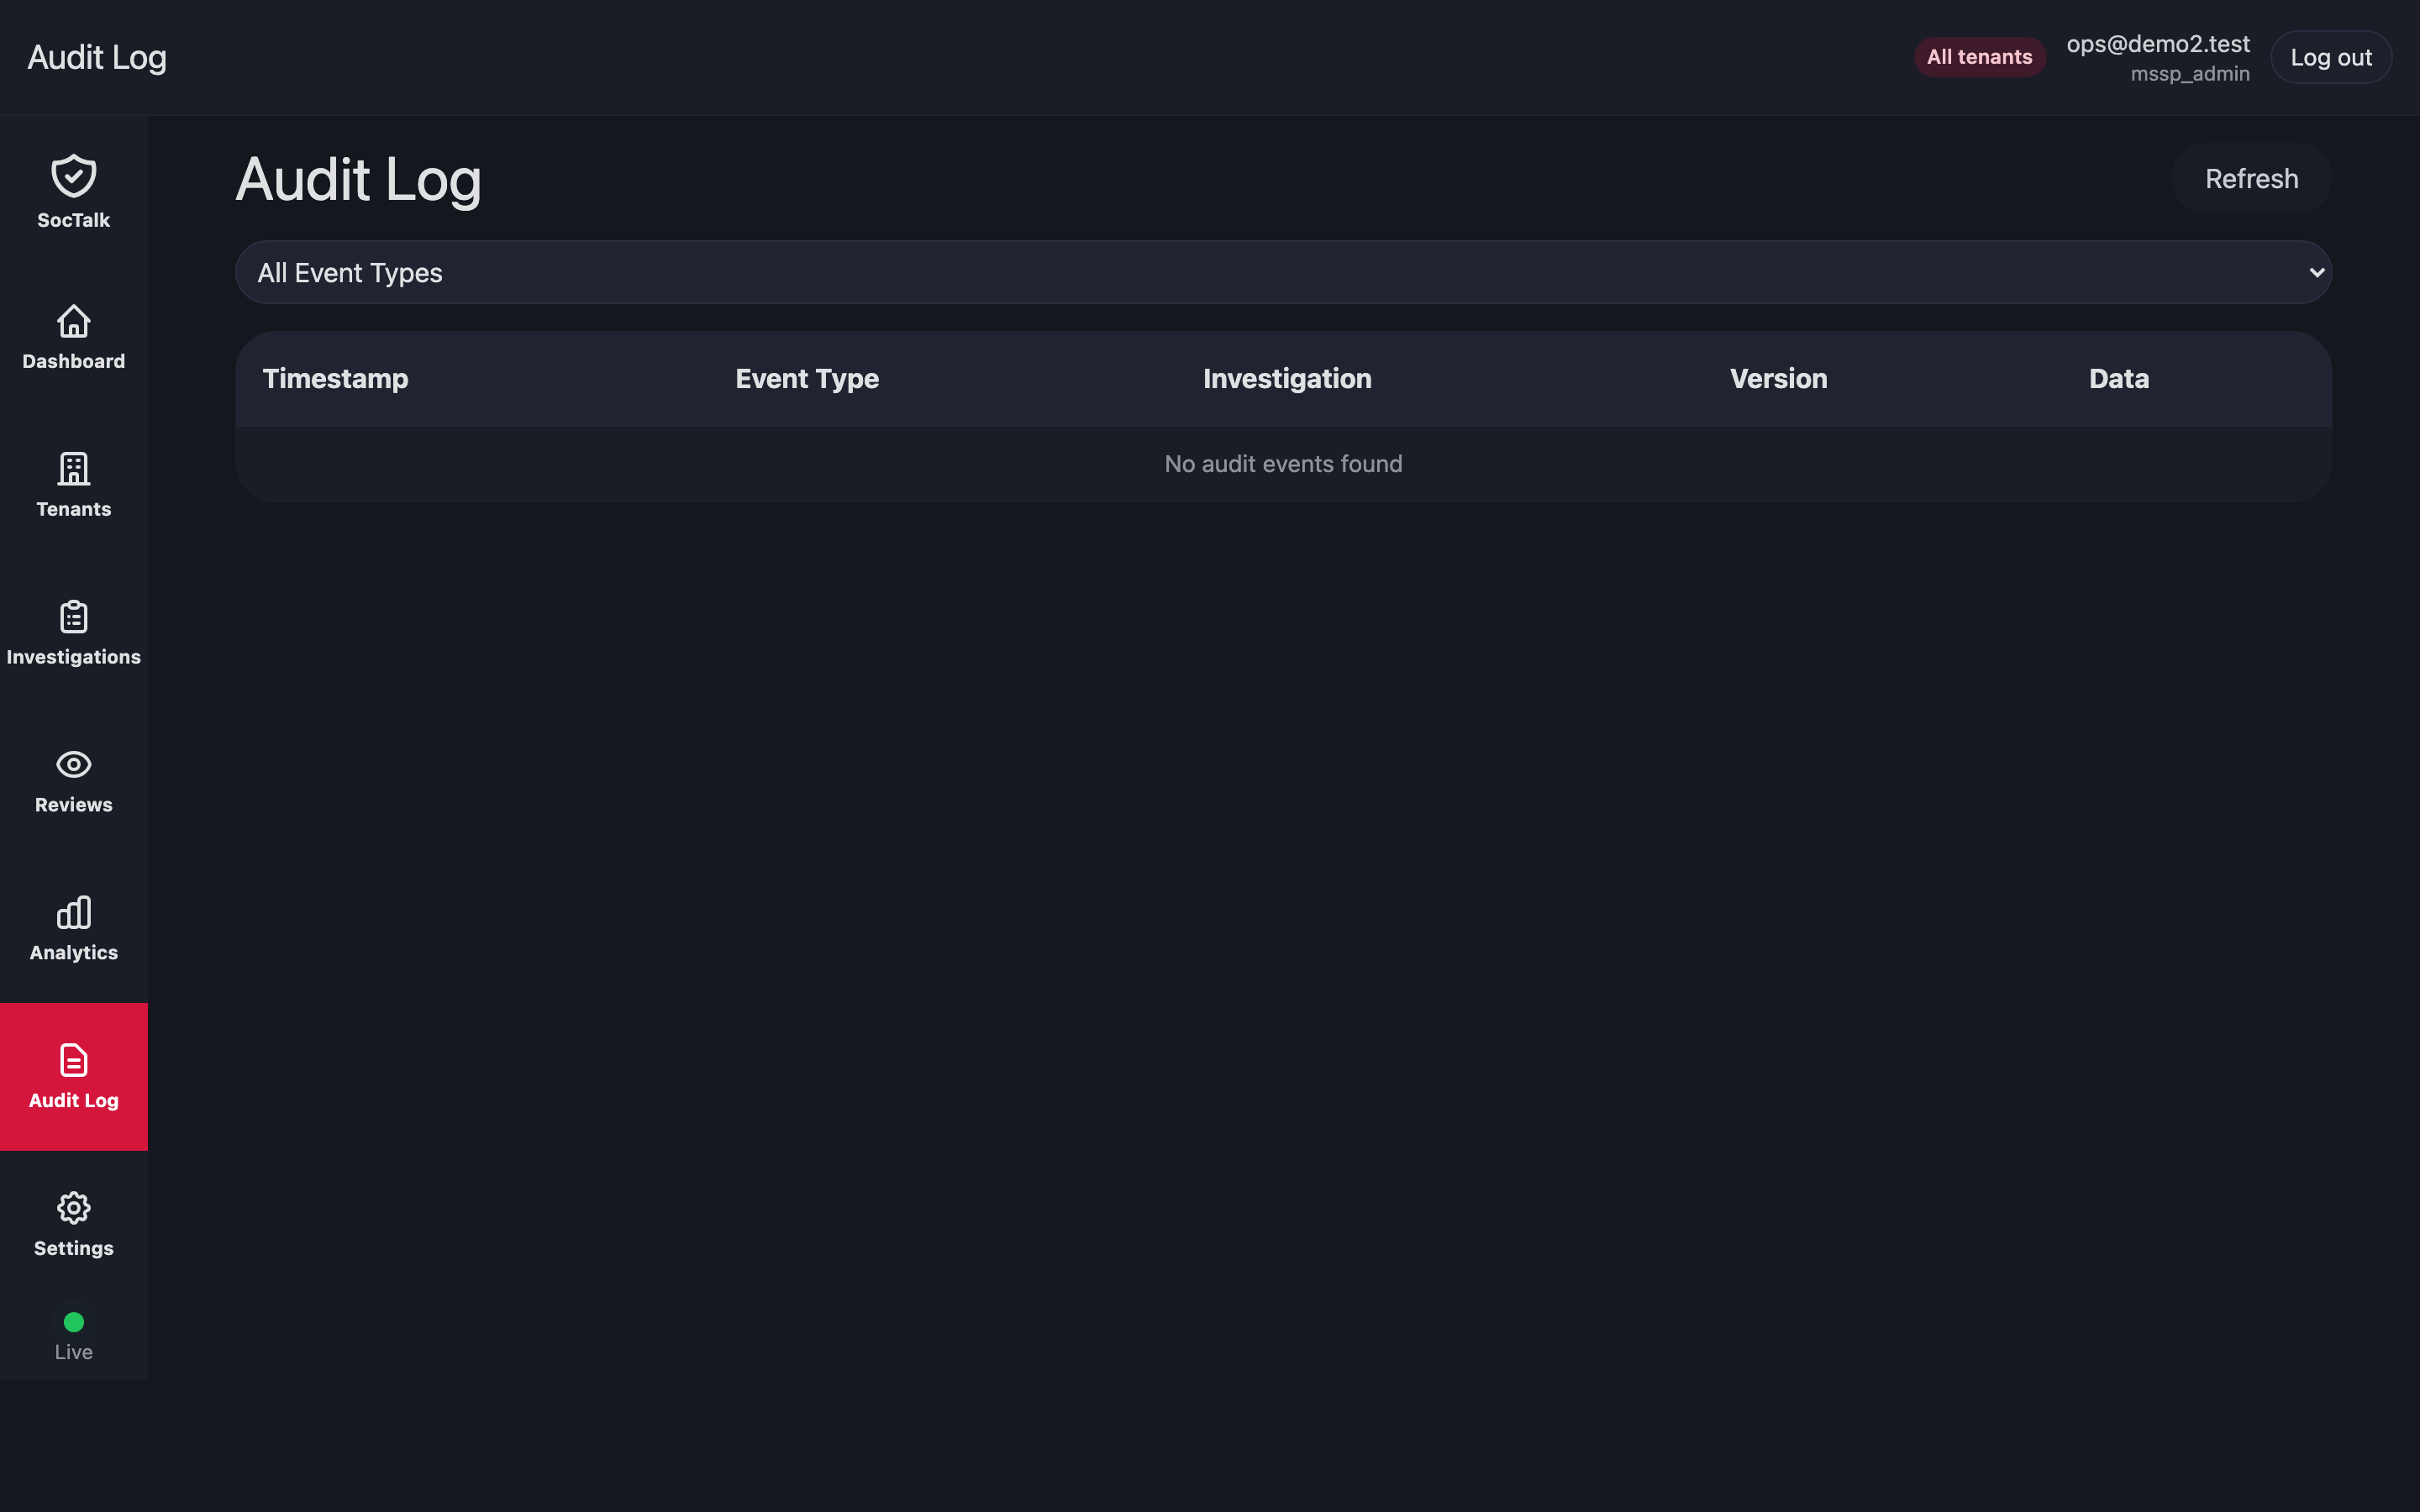
MSSP-wide append-only audit. Filter by Event Type (Review Requested / Review Completed / Tenant Onboarded / Decommissioned / Key Rotated / …). Columns: Timestamp, Event Type, Investigation (deep link), Version (event-sourced row version), Data (expandable JSON payload).
For compliance exports, hit the API directly:
curl 'https://mssp.your-mssp.example/api/audit?since=2026-01-01&tenant=<id>' > audit.jsonSettings
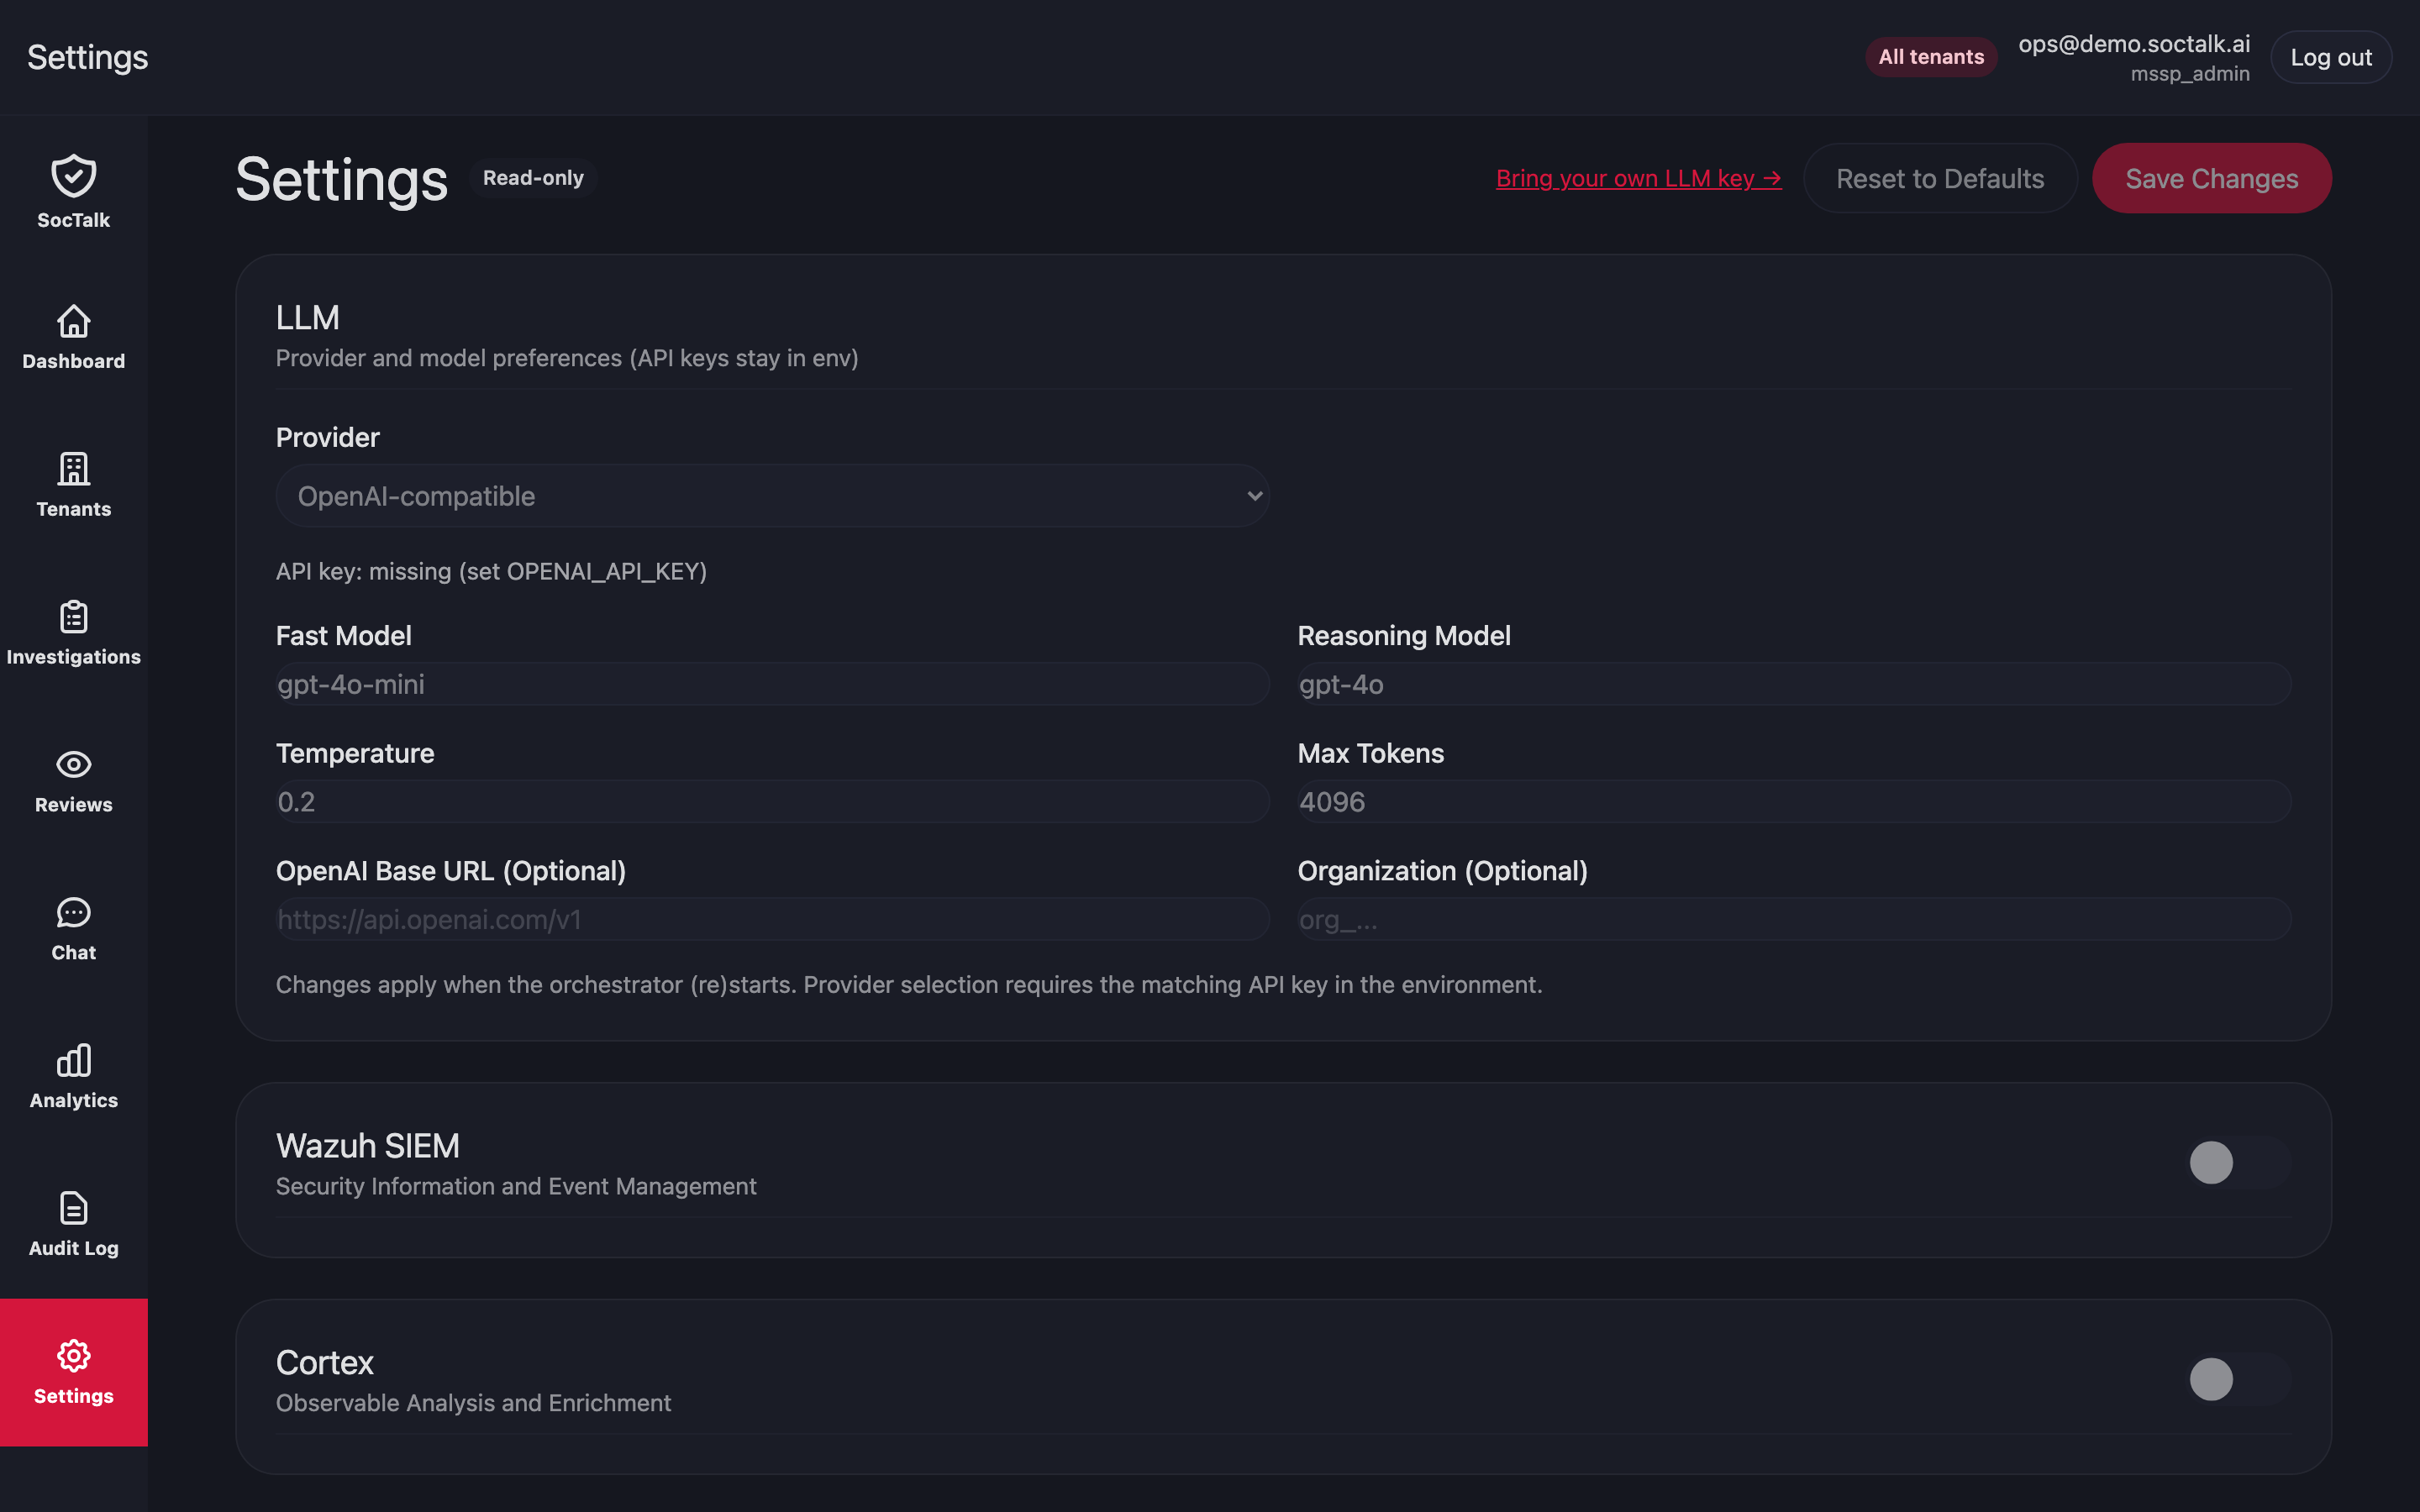
MSSP-wide settings page. In V1 this page shows hard-coded stub values: GET /api/settings returns a static read-only payload that does not reflect the install's actual configuration. The page is informational only; it is not a window into the live install settings, and the Save Changes button is a no-op. A real settings surface that mirrors env-derived state is on the roadmap. Per-tenant LLM mutation is the one settings surface that actually works in V1; see LLM detail page.
Sections:
- LLM: Provider (
openai-compatible | anthropic), Fast Model, Reasoning Model, Temperature, Max Tokens, optional Base URL + Organization. API keys live in environment / Kubernetes Secrets, never in this form. - Wazuh SIEM: enable toggle, URL, credentials.
- Cortex: enable toggle, URL, credentials. External integration, not a bundled subchart; the URL points at the tenant's Cortex instance (see /integrate/cortex).
- TheHive: enable toggle, URL, organisation, credentials. External integration, not a bundled subchart; the URL points at the tenant's TheHive instance (see /integrate/thehive).
- Slack: webhook + interactive backend config.
The Bring your own LLM key → link goes to per-tenant LLM key rotation (per-tenant LLM keys override the install-wide one).
LLM detail page
Standalone page reachable from Settings → Bring your own LLM key →. In V1 this is per-tenant BYOK key entry only: the form takes the API key for the currently-scoped tenant and submits it via PUT /api/tenant/llm/api-key (the tenant-side endpoint; MSSP admins can also use PUT /api/mssp/tenants/{tenant_id}/llm/api-key). The other LLM fields (provider, model, temperature) shown on the parent Settings page are stub values; they are not editable here either. See Daily Operations → Rotate per-tenant LLM key for the rotation procedure.
See also
- Daily Operations, the runbook side of these pages (review, investigations, decommission, rotation).
- Wazuh Ingress, the agent onboarding flow from tenant detail.
- Security Model, what each MSSP role (
platform_admin,mssp_admin,analyst,customer_viewer) is allowed to do.